
What you gain from the first load.
YALineo installs in the browser of each person who needs it. It reads what Databricks already records (lineage, billing, query history) and links it on one map, with each person's permissions.
Benefits
Lineage, the bill and the budget in one place
Each station shows what its tables cost, and the Calculator prices the workload you are about to add. You see what depends on a table, what it costs and what the next step will cost.
Catalogs, schemas, tables, jobs, pipelines and SQL warehouses linked to the lineage; AI and Genie by product (Genie Code, Genie One, Genie Agents); estimates on Azure, AWS and GCP, services included.
Easy to clear with security
Your metadata travels between your workspace and your browser, with no YALineo server. YALineo reads with your permissions and sends only SELECT statements.
Before a query leaves, YALineo checks that it is read only, and each one carries the "yalineo" mark in the query history.
A published method for every cost
Every cost comes from Databricks billing and shows its nature: observed, attributed by a written rule, estimated or potential. Next to a zero, missing or partial cost, "Why?" gives the measured reason.
The shares add up to the total to the cent, and each card is compared with the previous period.
Inside Databricks, where you already work.
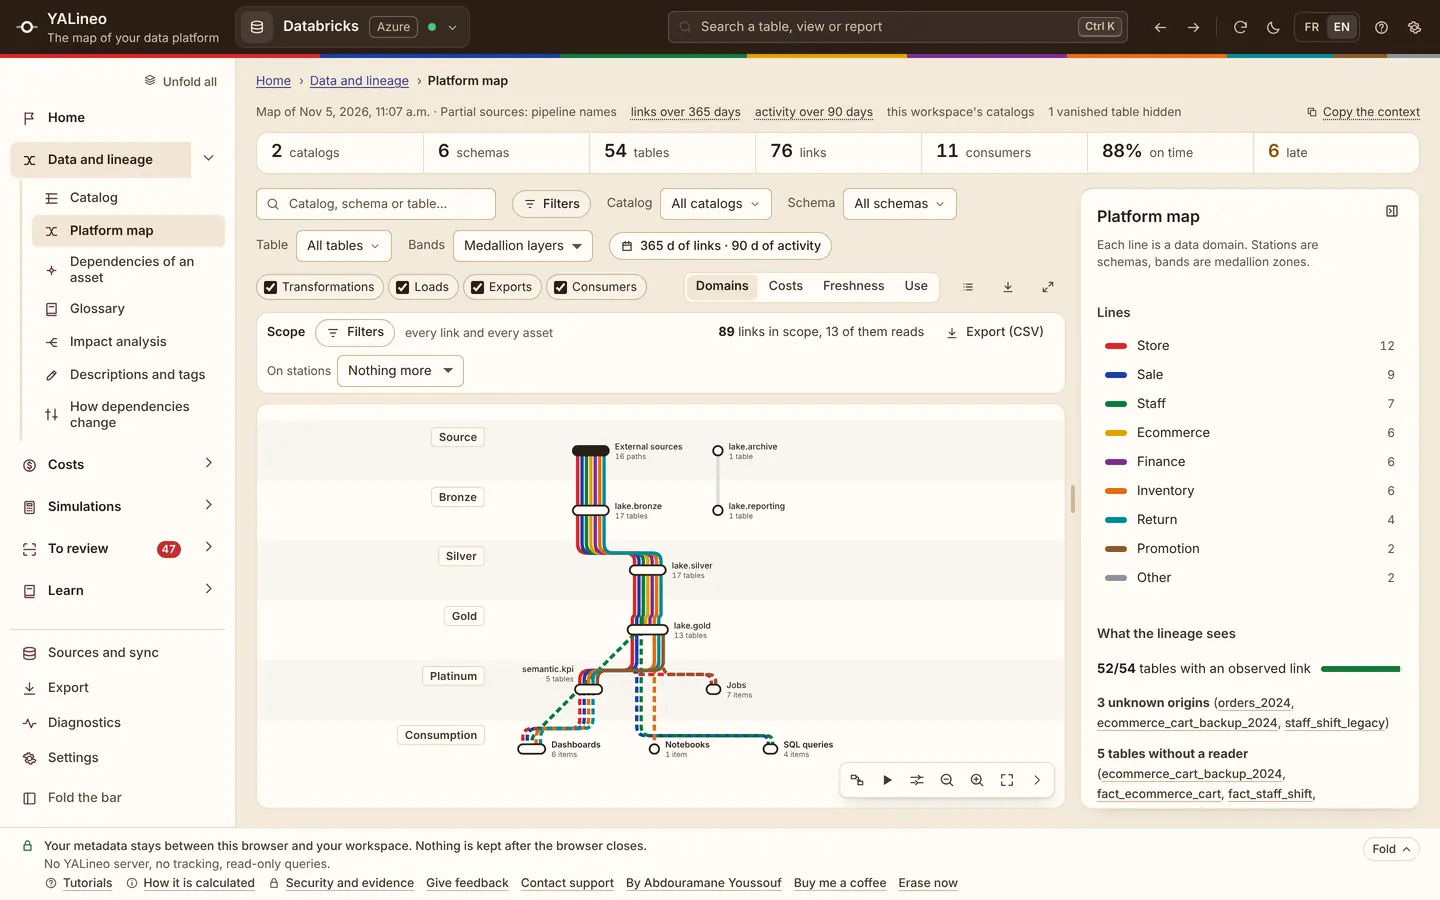
Pick a screen, and its numbered marks light up one by one. Screenshots taken on a fictional test workspace: made-up data, workspace address masked.
View capture 1 of 2 full sizeView capture 2 of 2 full size


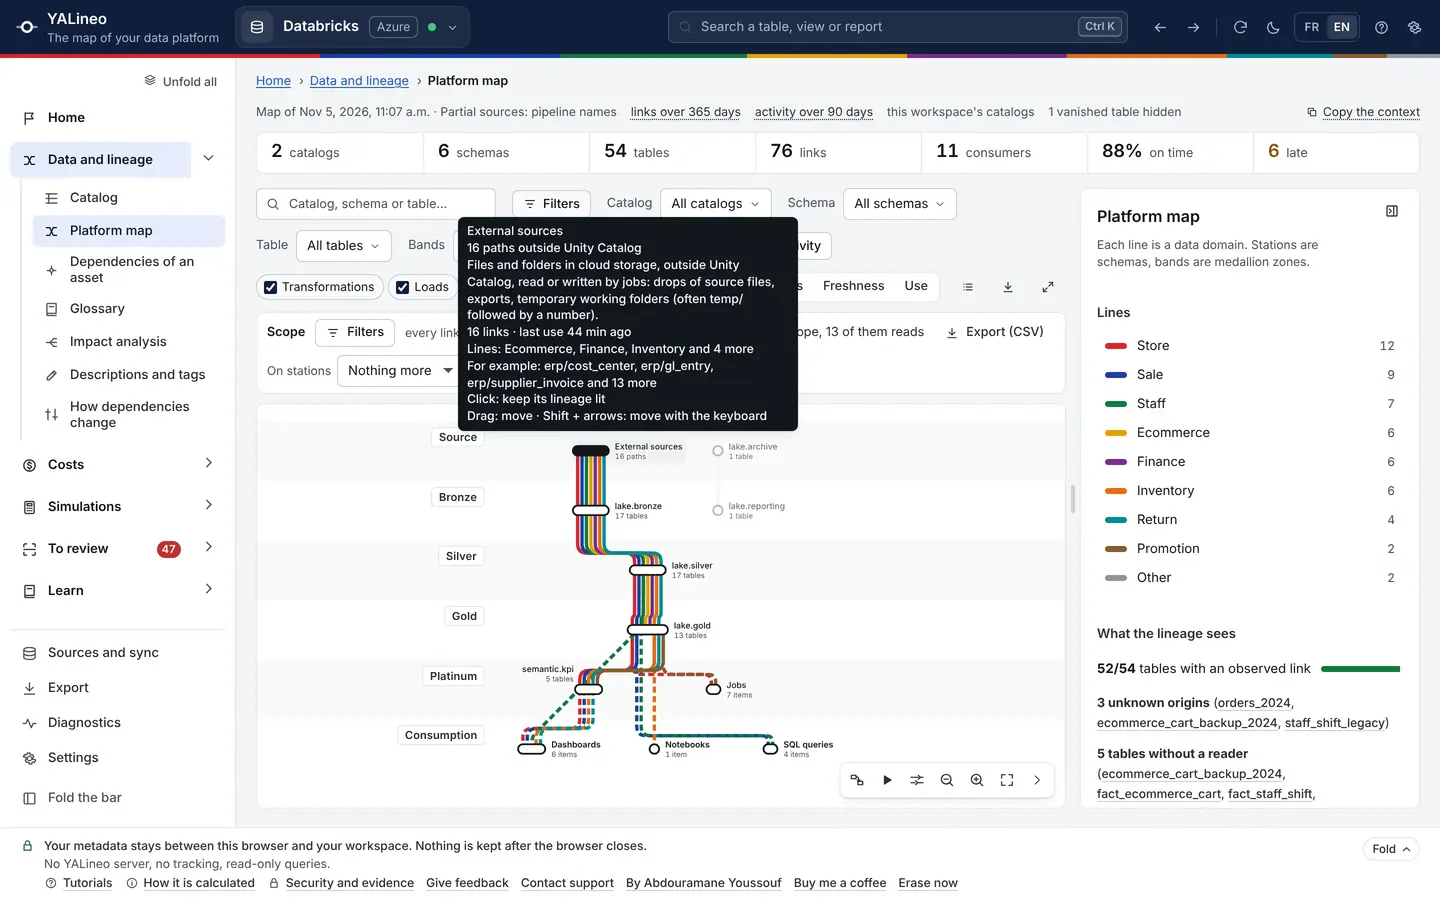
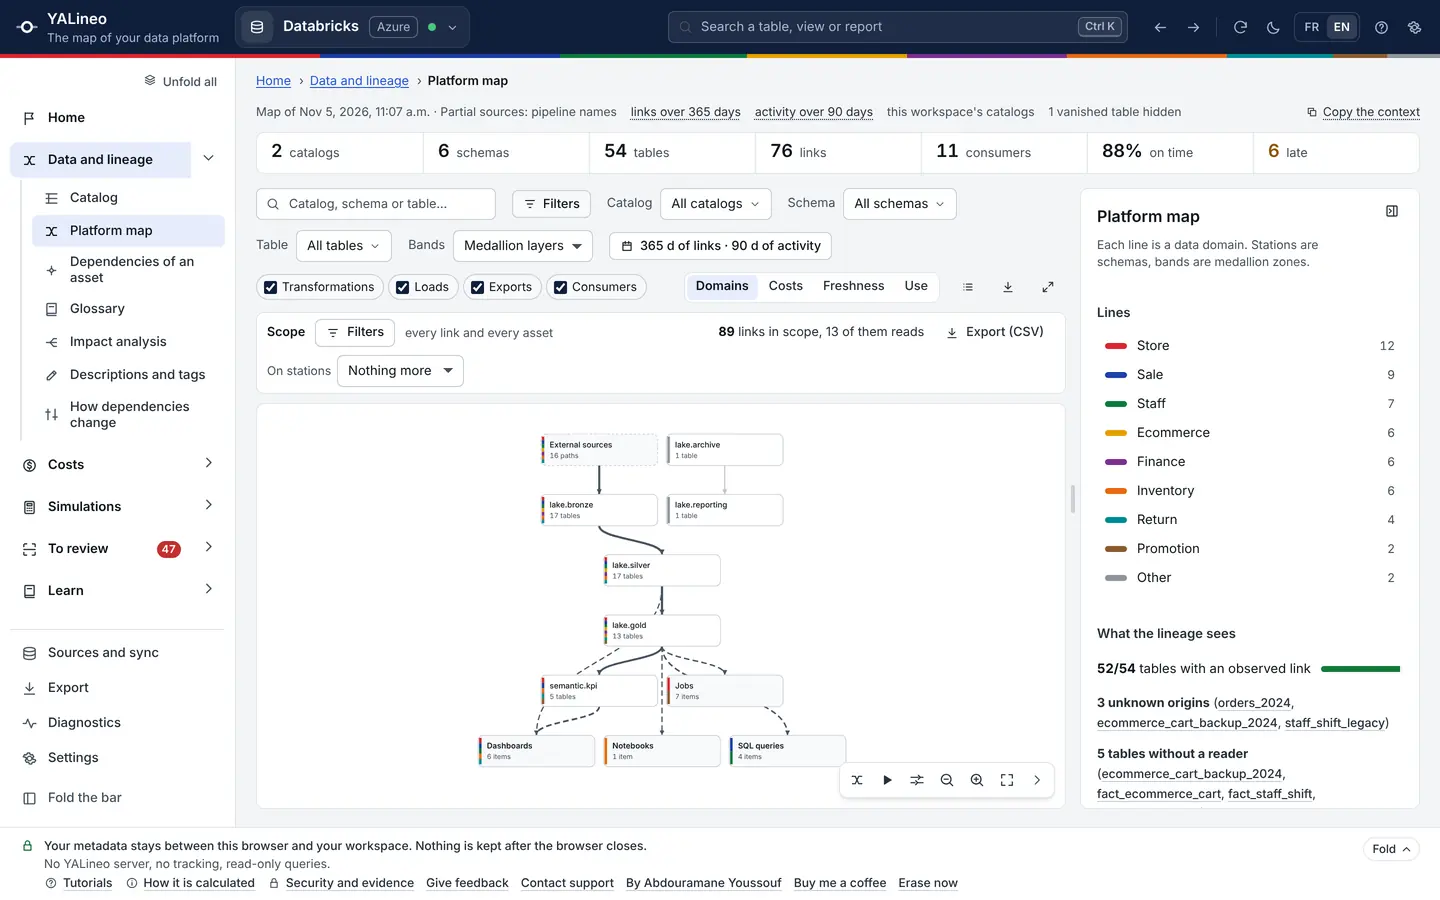
- 1The figures of what is shown
- 2One line per domain, one station per schema
- 3On hover, the figures of each element
- 4The legend of the lines
- 5The same lineage, as a graph
- 6Consumers, at the end of the lines
- 7Link types
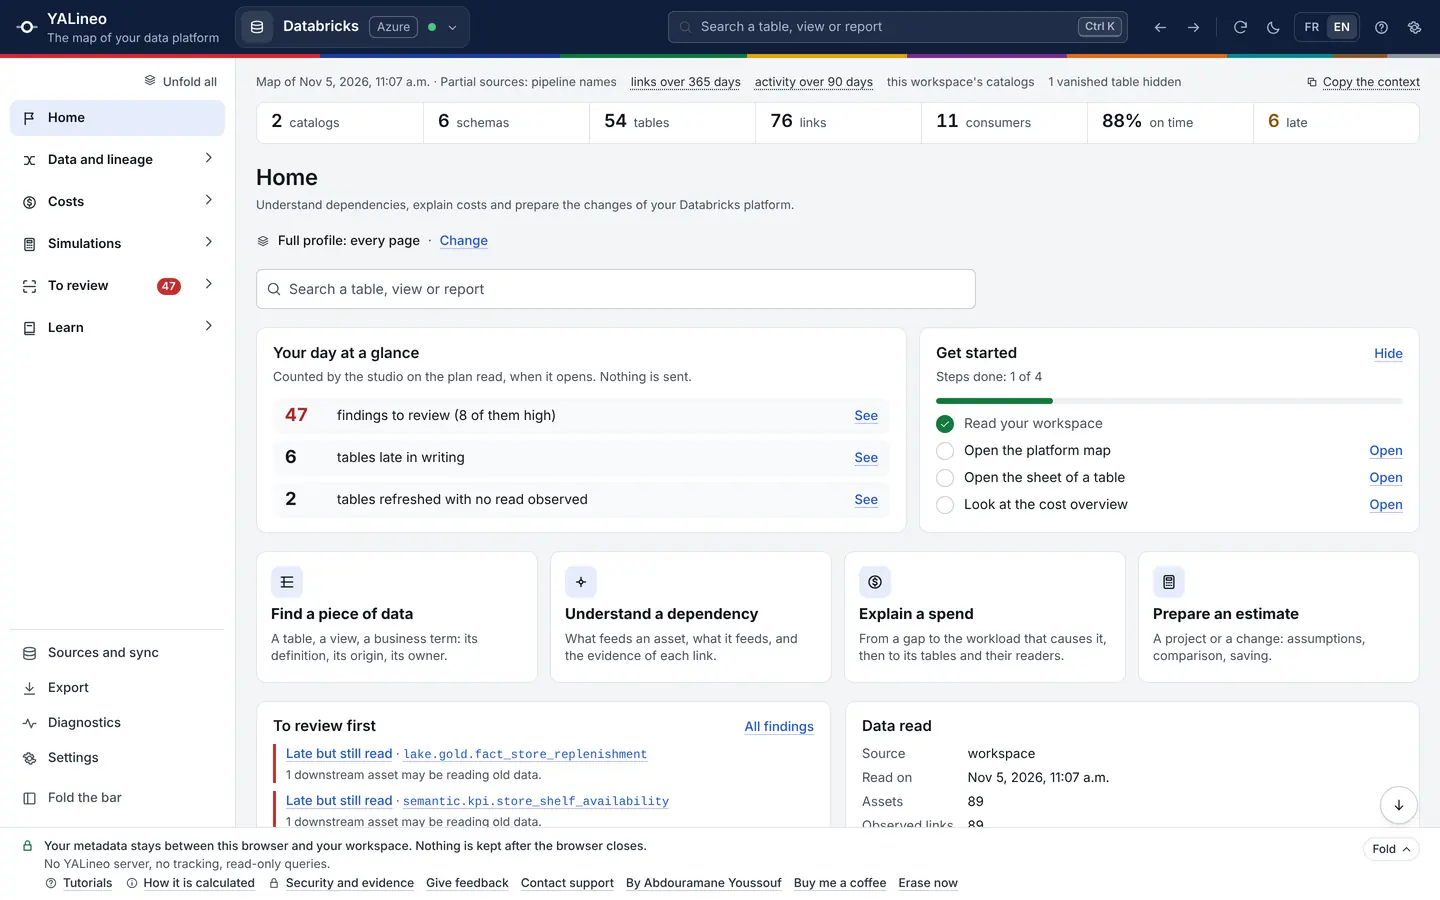

- 1Your profile, changed in the settings
- 2One search, for any asset
- 3Four ways in, to the right page
- 4The first findings to review
- 5The data read, and its state
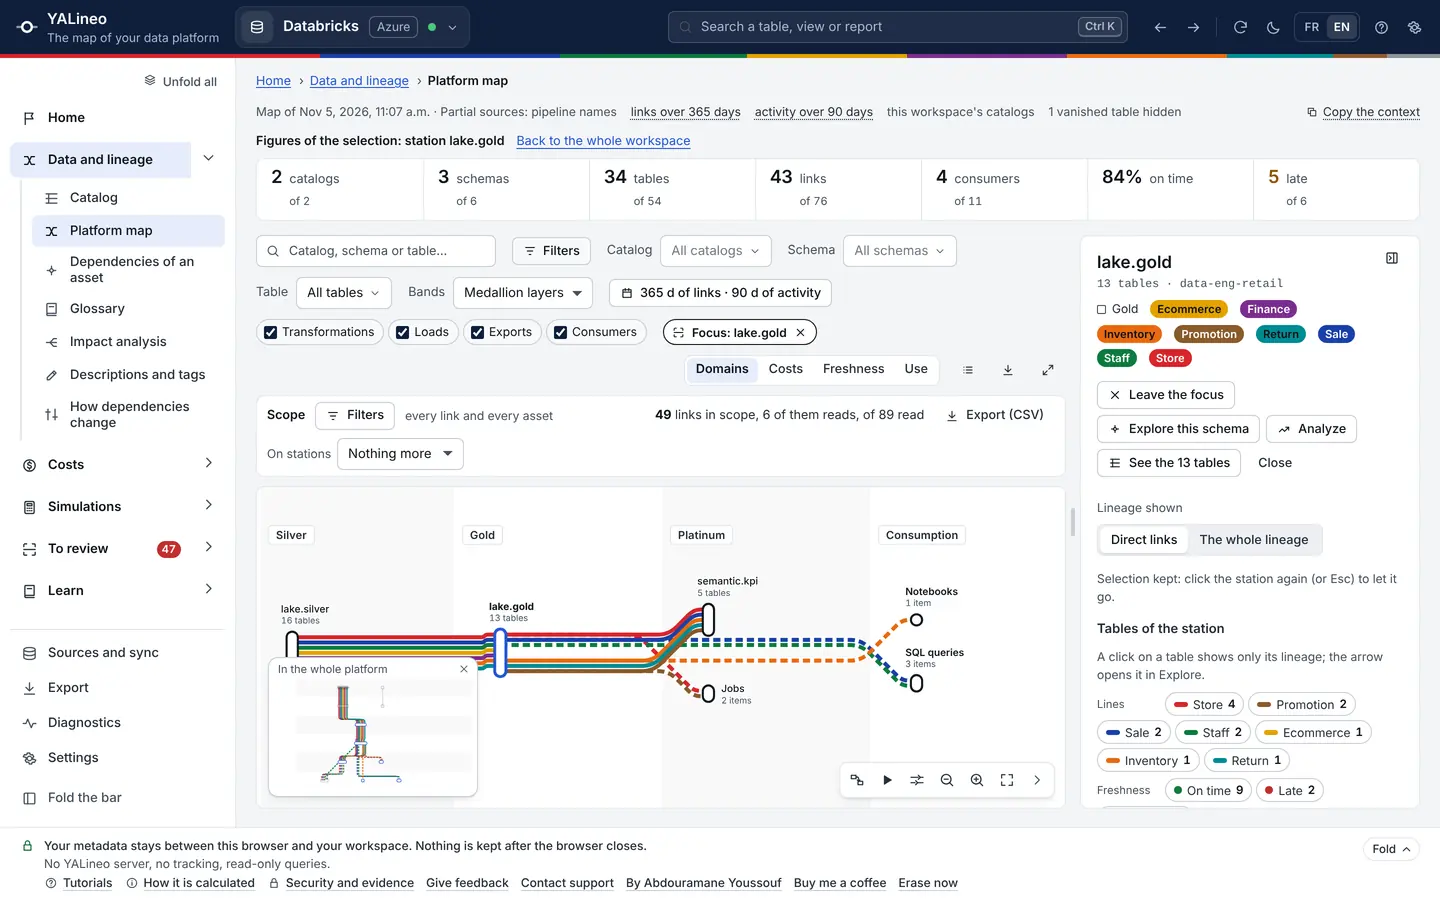

- 1The station's figures, out of the total
- 2Focus on one station
- 3Only the lineage of its tables
- 4The station's actions
- 5Its tables, by line and freshness
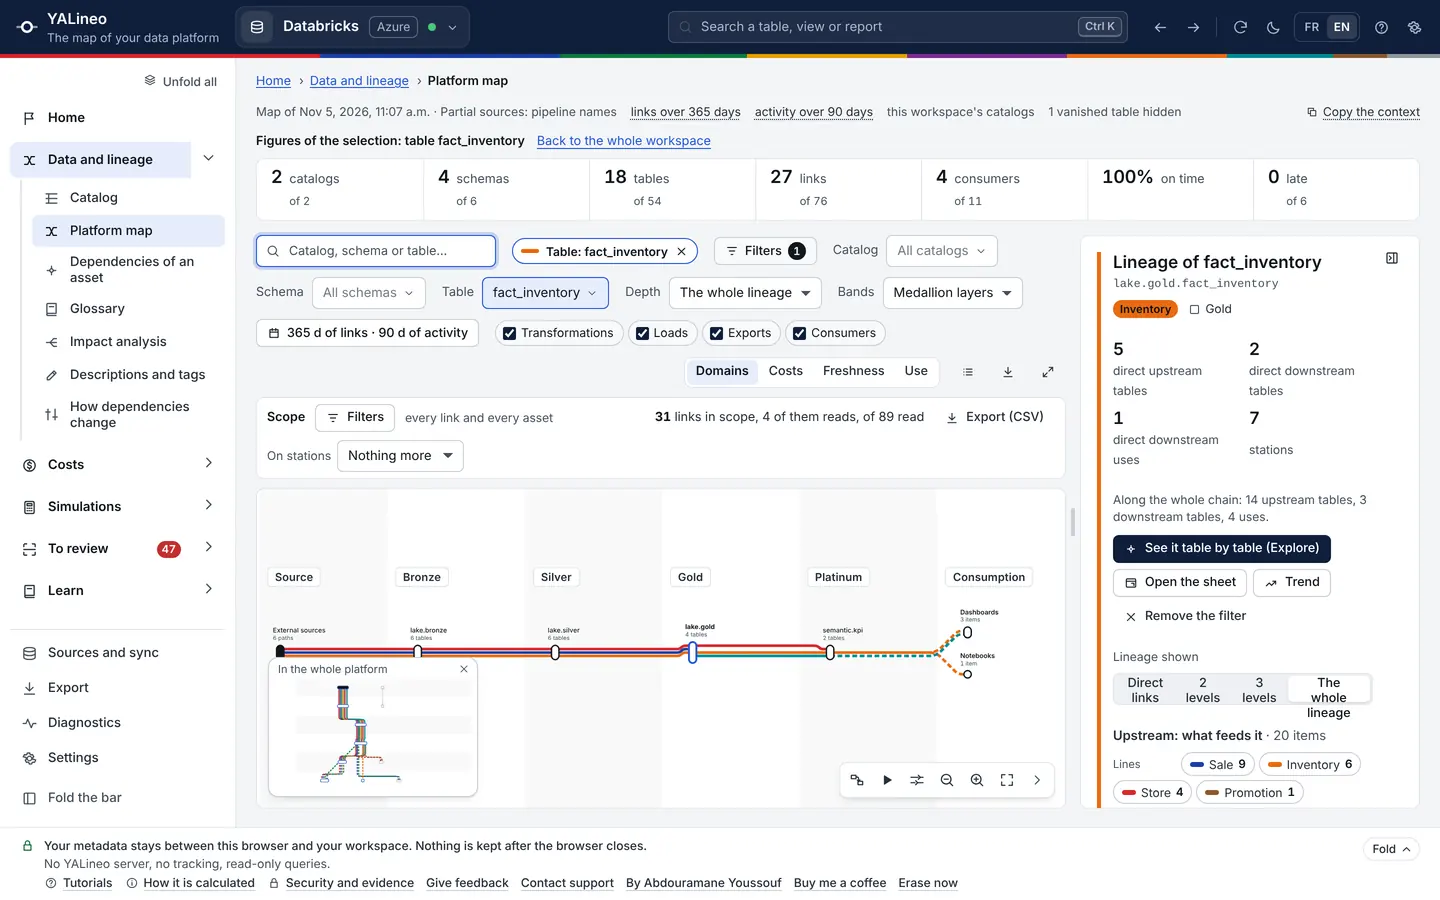

- 1The table followed
- 2Its route, from source to report
- 3Direct neighbors, then the whole chain
- 4What feeds it and what depends on it
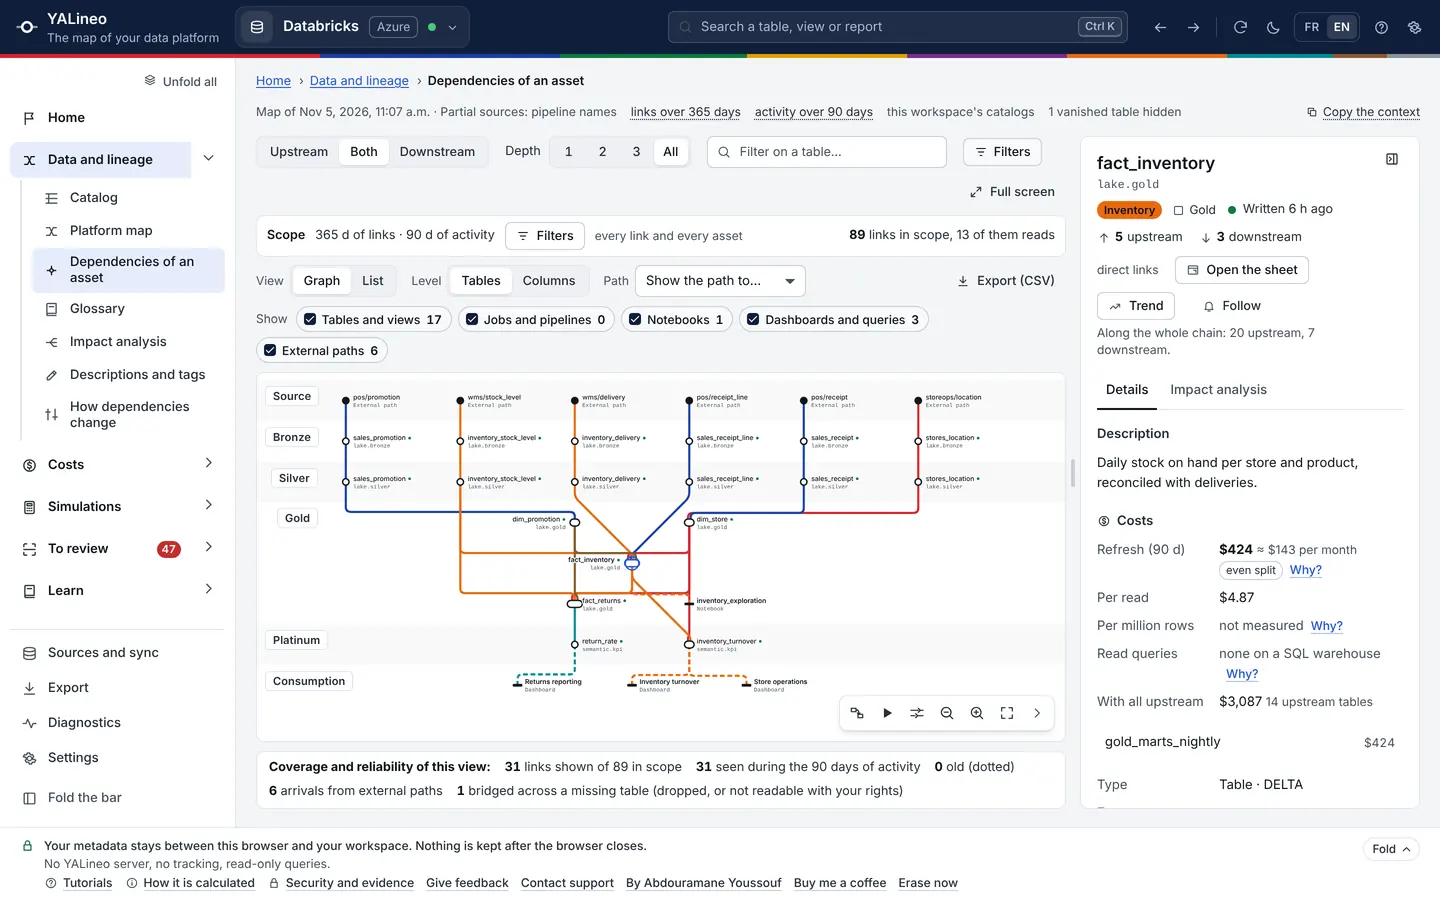

- 1Depth and kinds of assets in one click
- 2The table, at the center of its route
- 3Direct neighbors, then the whole chain
- 4What the table costs, and why
- 5What the view shows and what it bridges
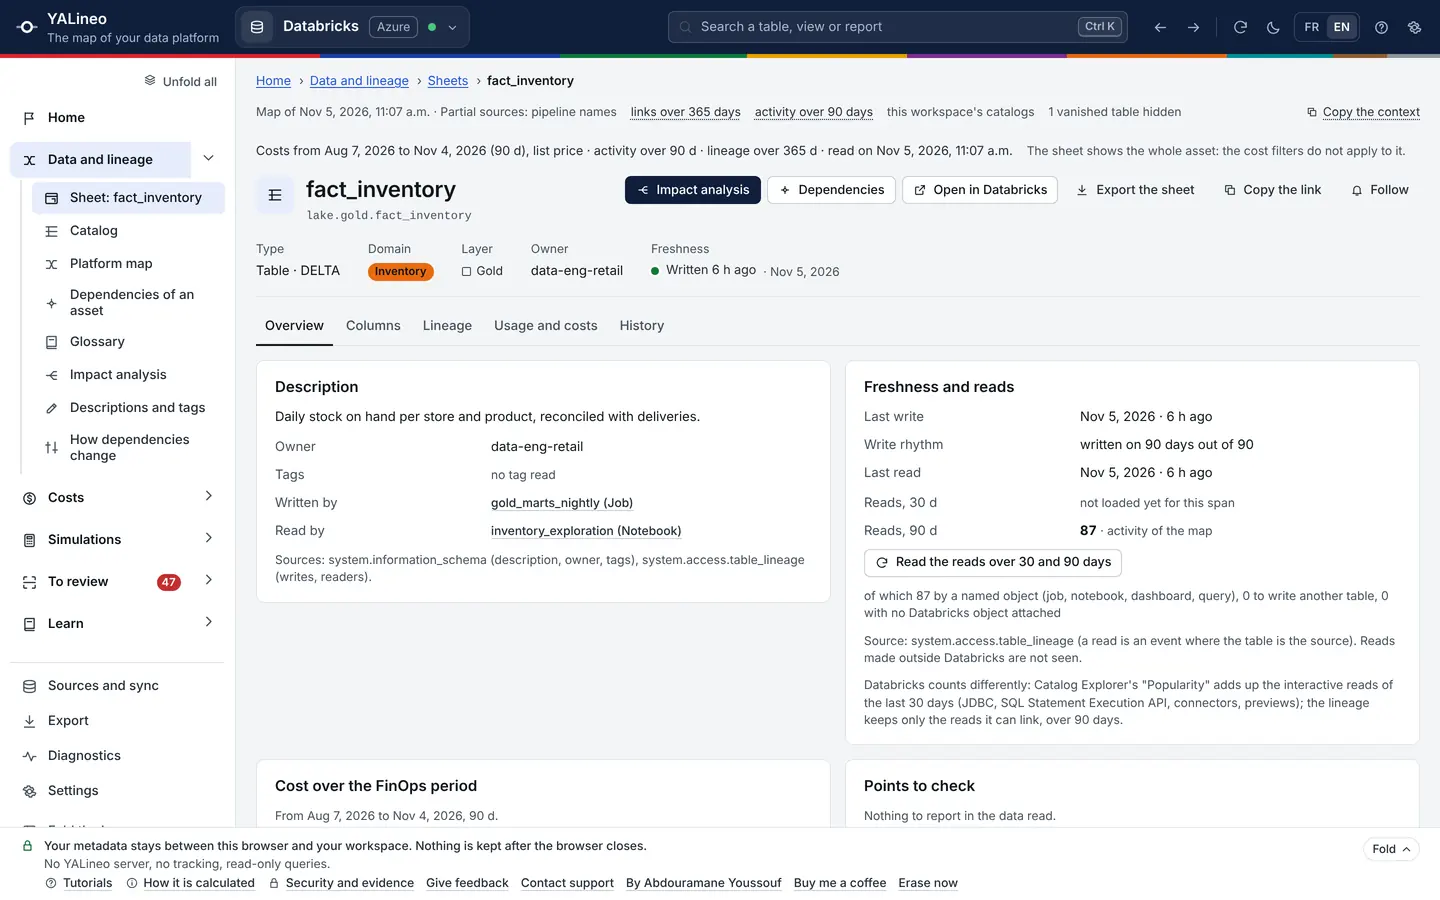

- 1The asset and its actions
- 2Five tabs, only what was read
- 3Where its reads come from
- 4What Databricks counts differently
- 5Its cost, its nature and "Why?"
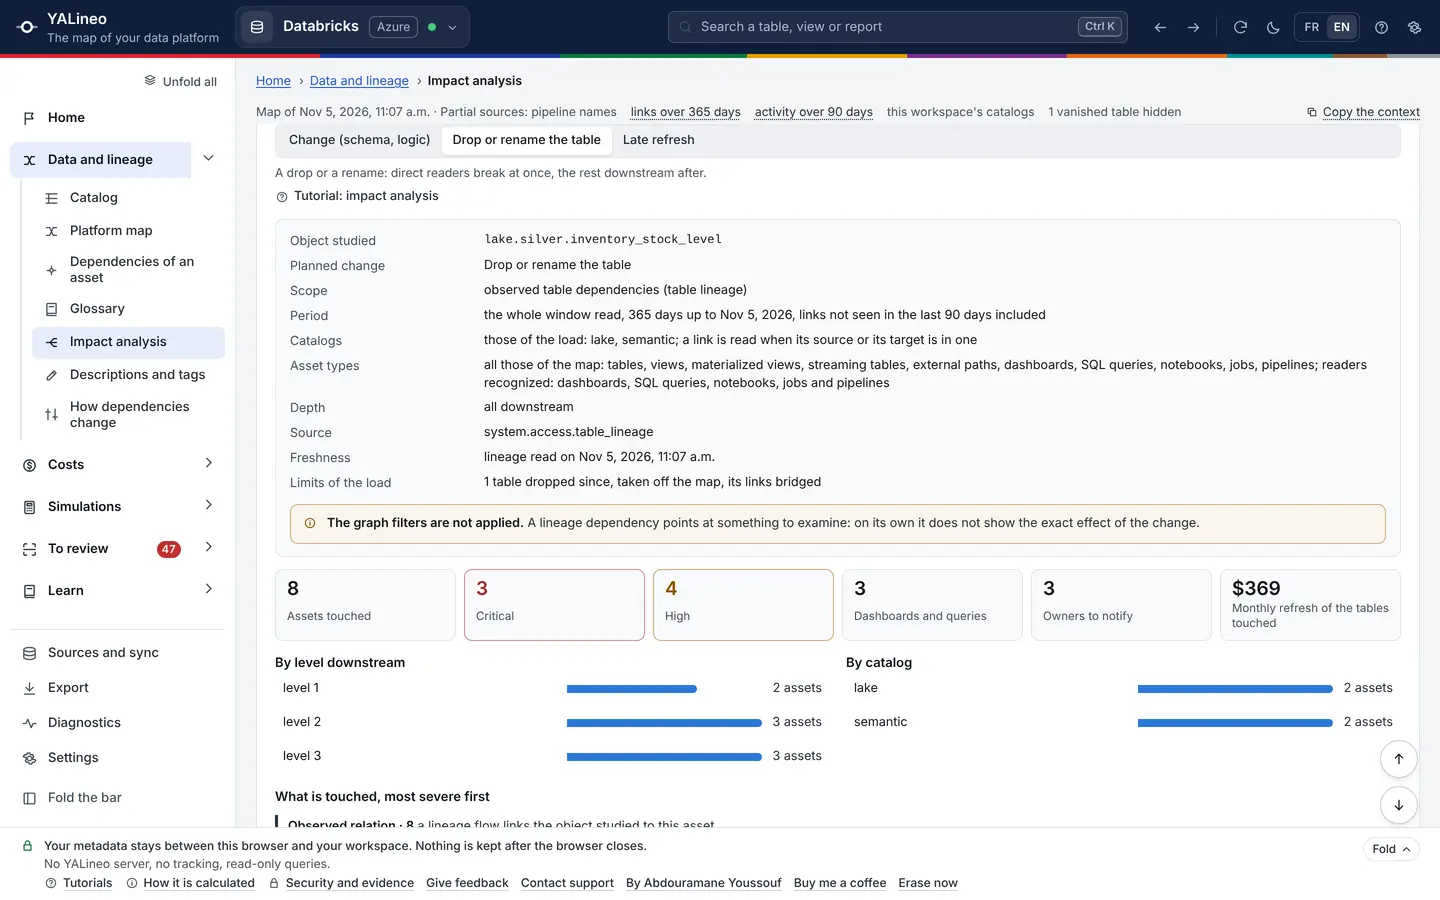

- 1The scenario studied
- 2Exactly what was read
- 3The figures that decide
- 4By downstream level and by catalog
- 5From most to least severe
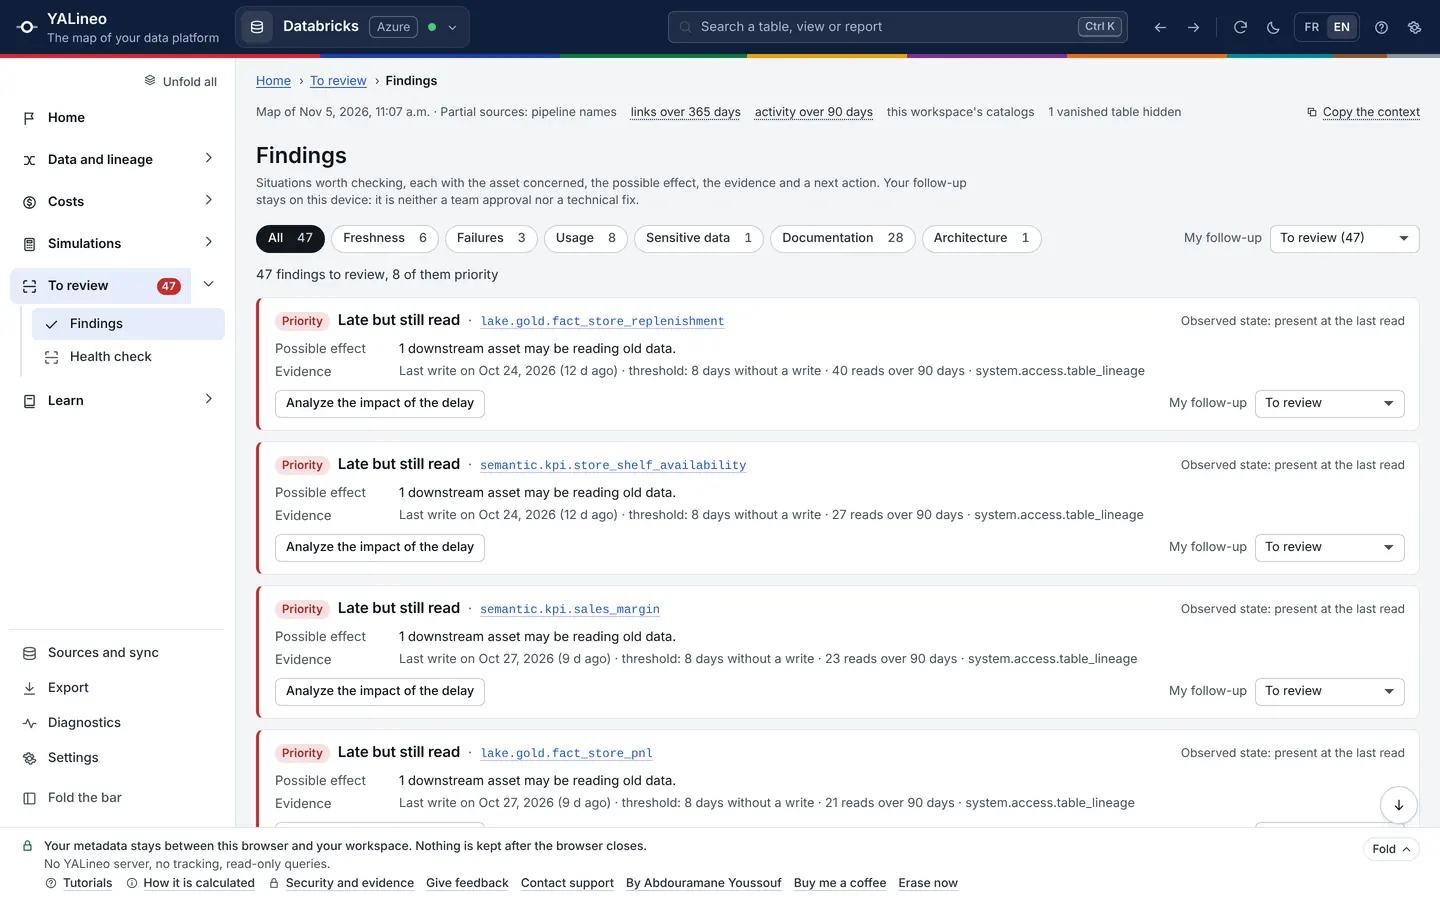

- 1Sorted by kind, with their count
- 2The asset and the possible effect
- 3The evidence: date, threshold, source
- 4An action to the right page
- 5Your dated follow-up
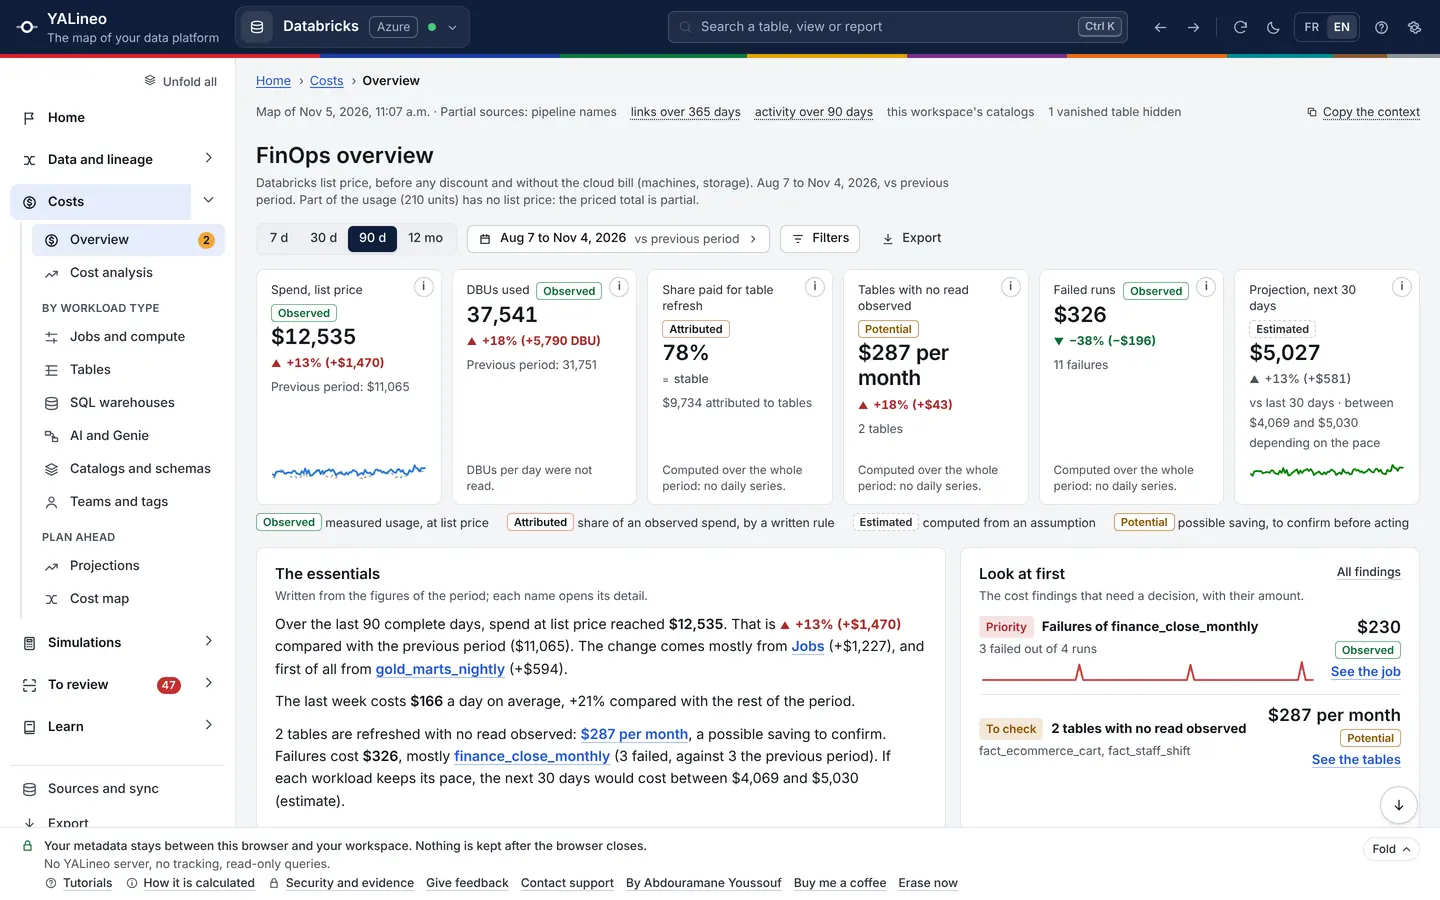

- 1The period, against the one before
- 2The period's spend
- 3Each amount states its nature
- 4The essentials, written from the figures
- 5What to look at first
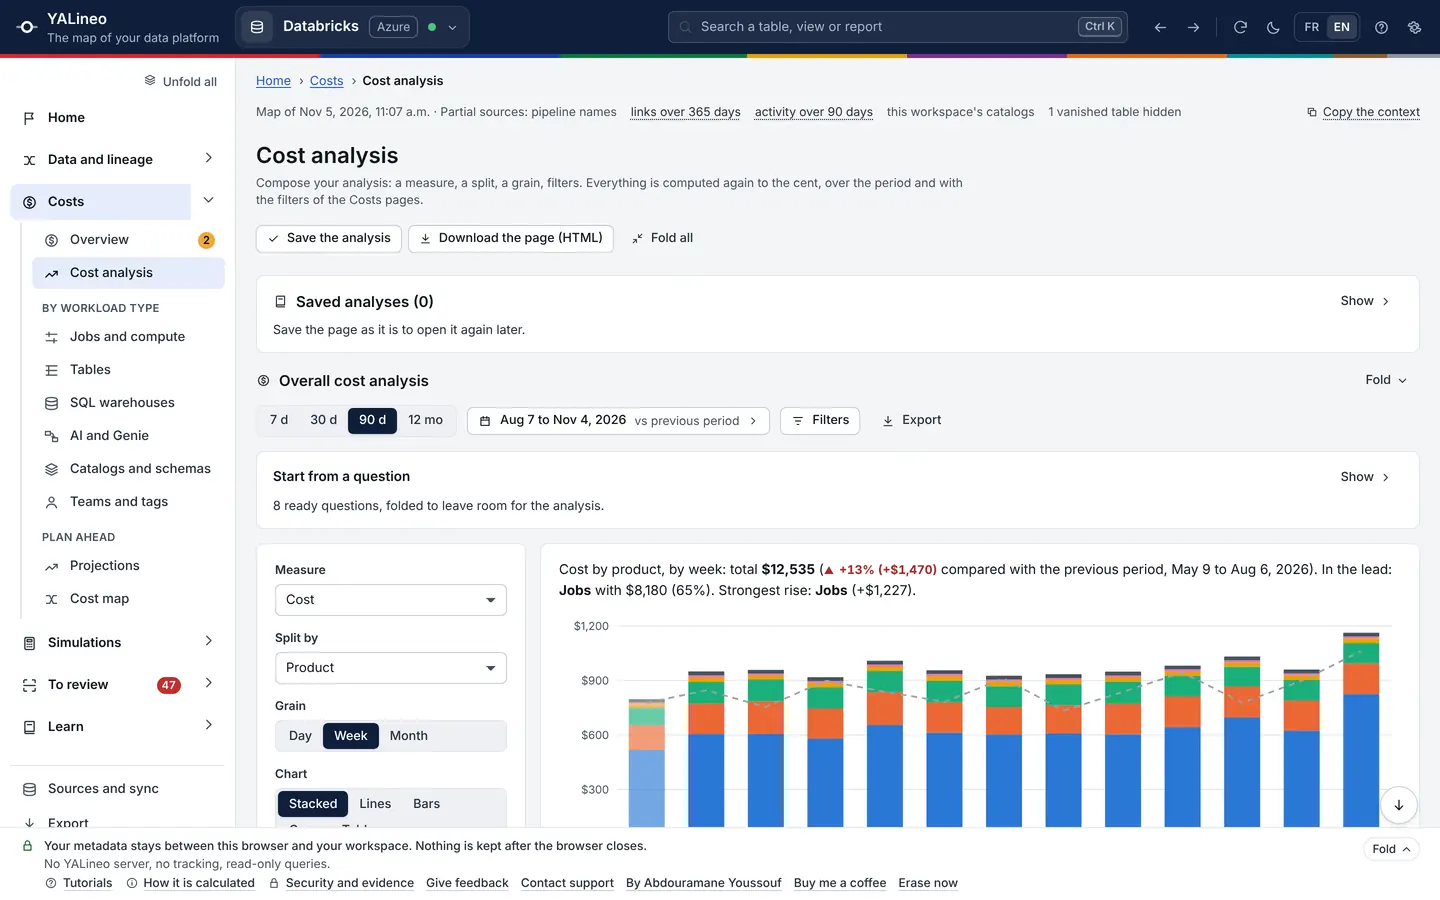

- 1Ready-made questions
- 2Measure, breakdown, grain and chart
- 3The answer in one sentence
- 4The period before, dotted
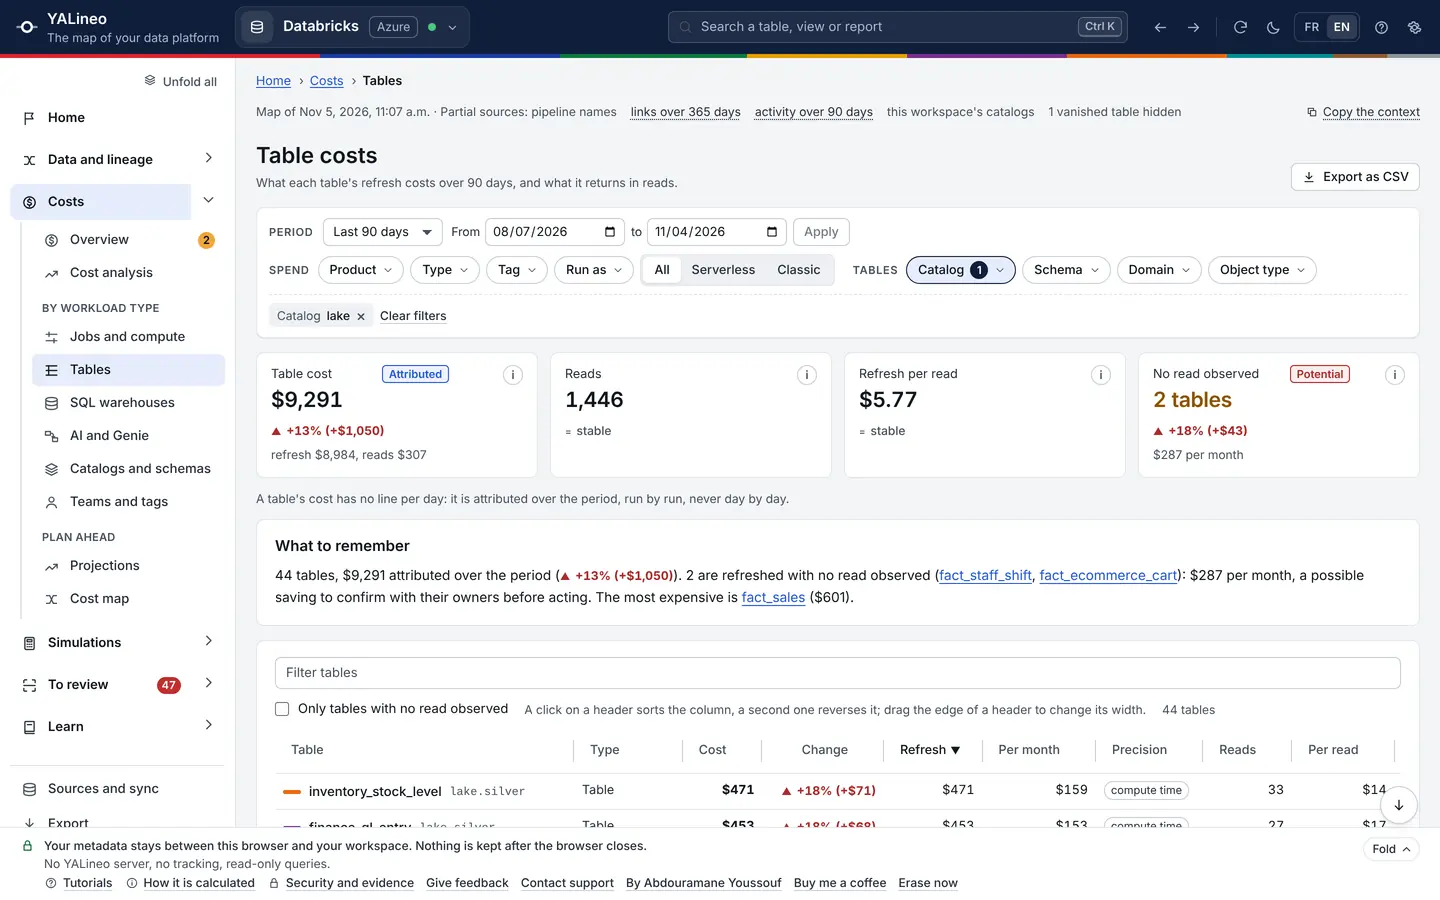

- 1The filters, here the lake catalog
- 2The cost of the tables, attributed
- 3No read observed: potential
- 4The type of each object
- 5How precise each figure is
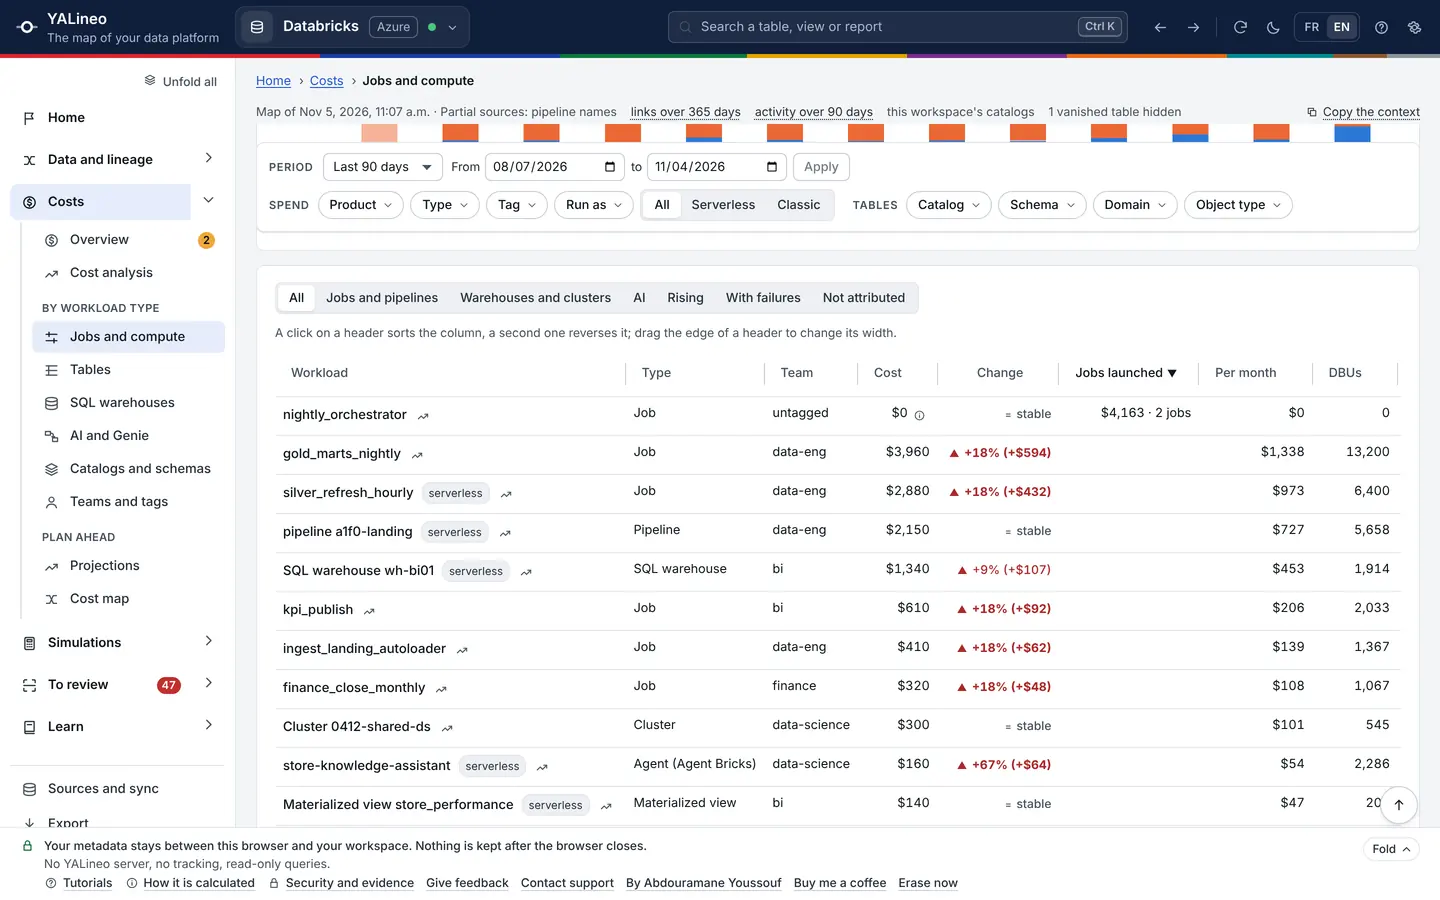

- 1By type, rising, with failures
- 2What the jobs it launches cost
- 3The gap with the period before
- 4Its trend, in one click
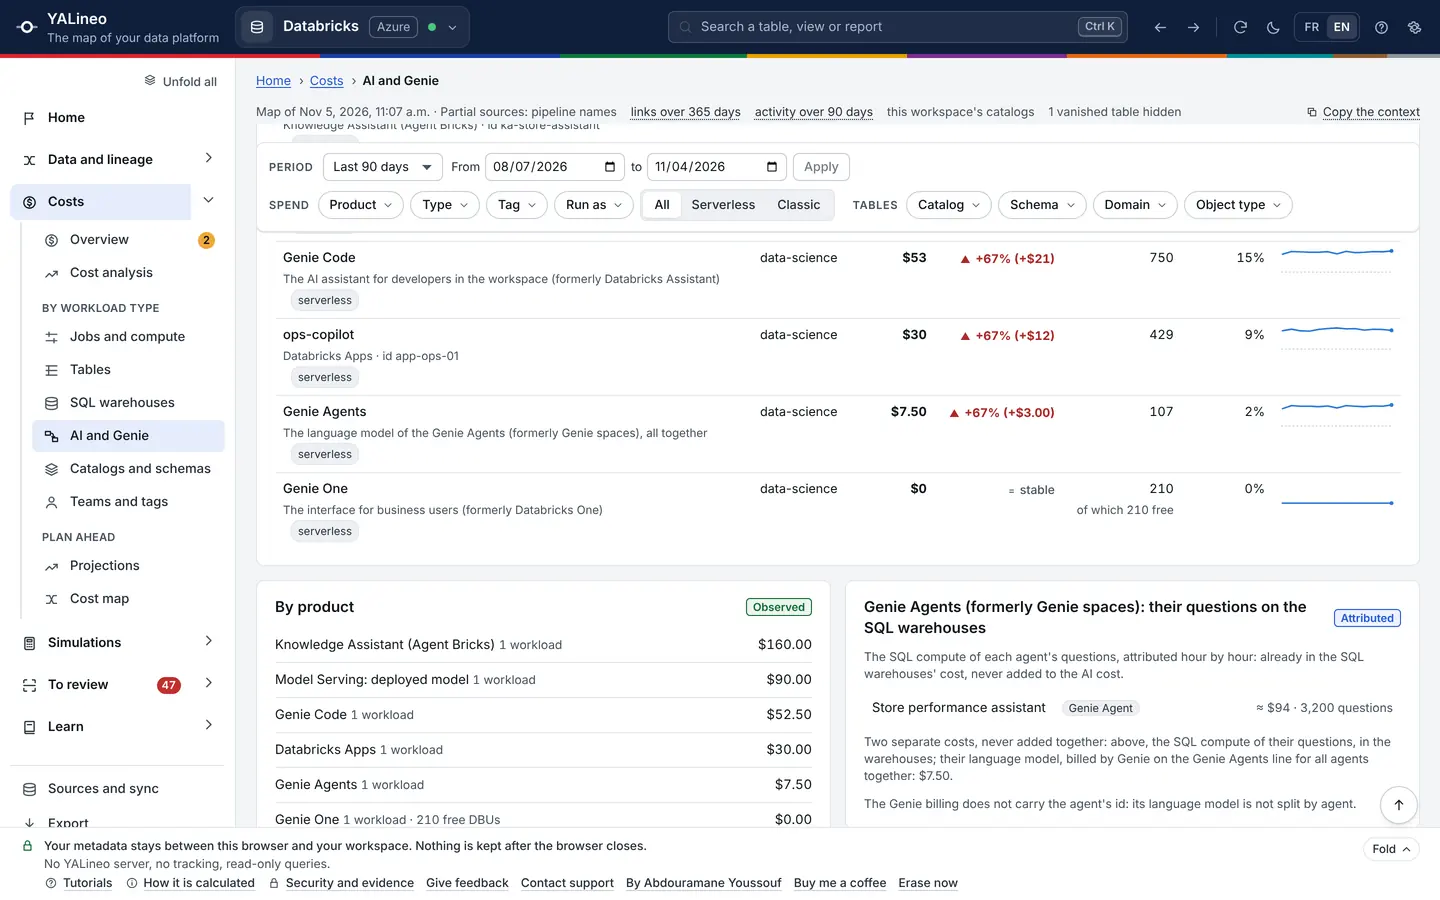

- 1Each line named by its billing
- 2Free usage, counted separately
- 3By product, to the cent
- 4The Genie Agents' questions
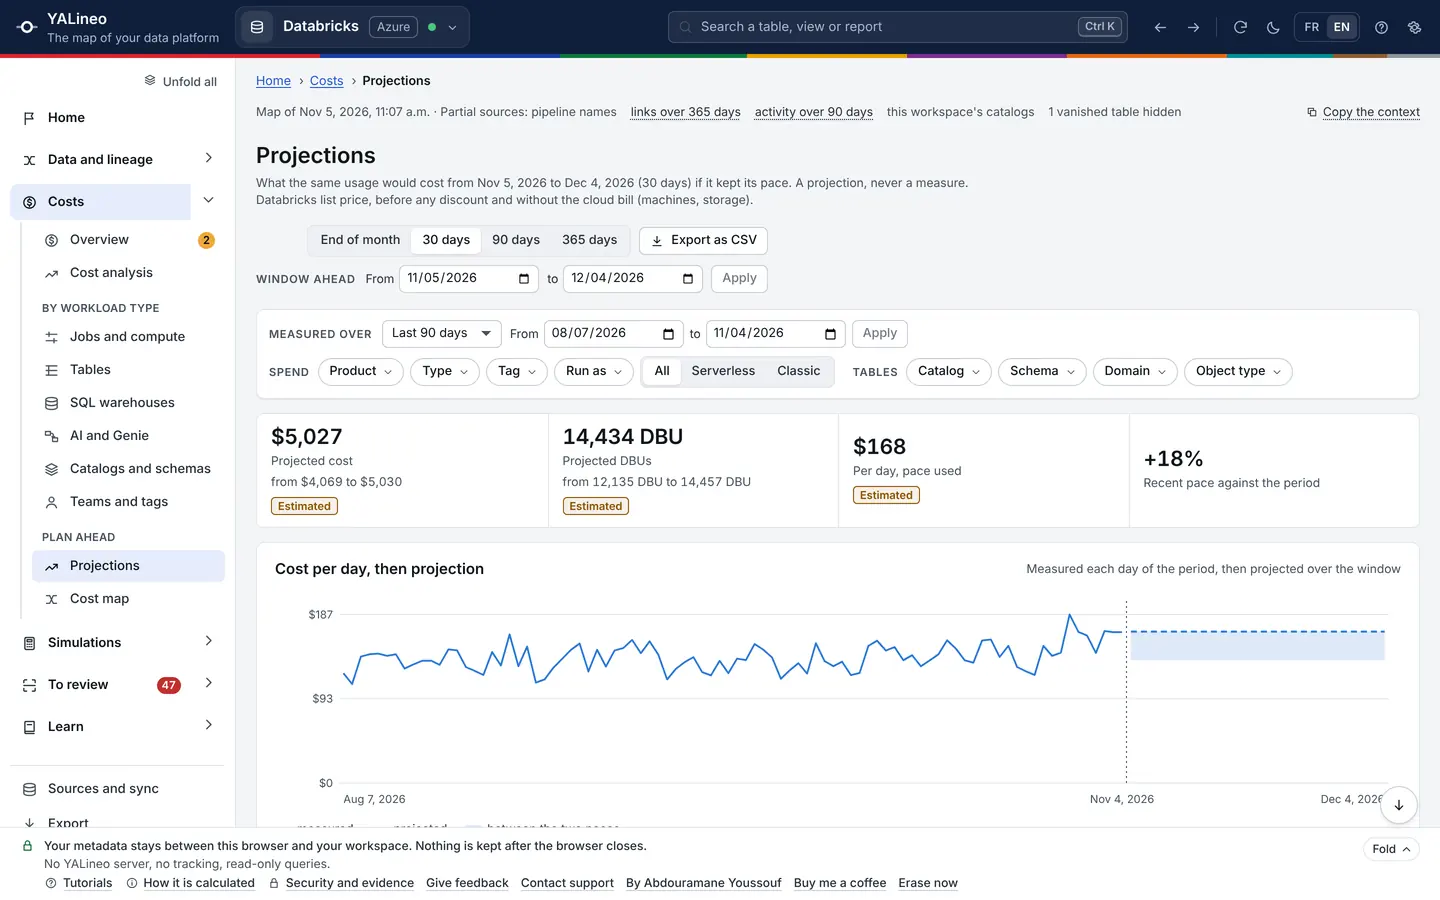

- 1End of month, 30, 90 or 365 days
- 2Or a window of future dates
- 3The projected cost, with its range
- 4Measured, then projected between two paces
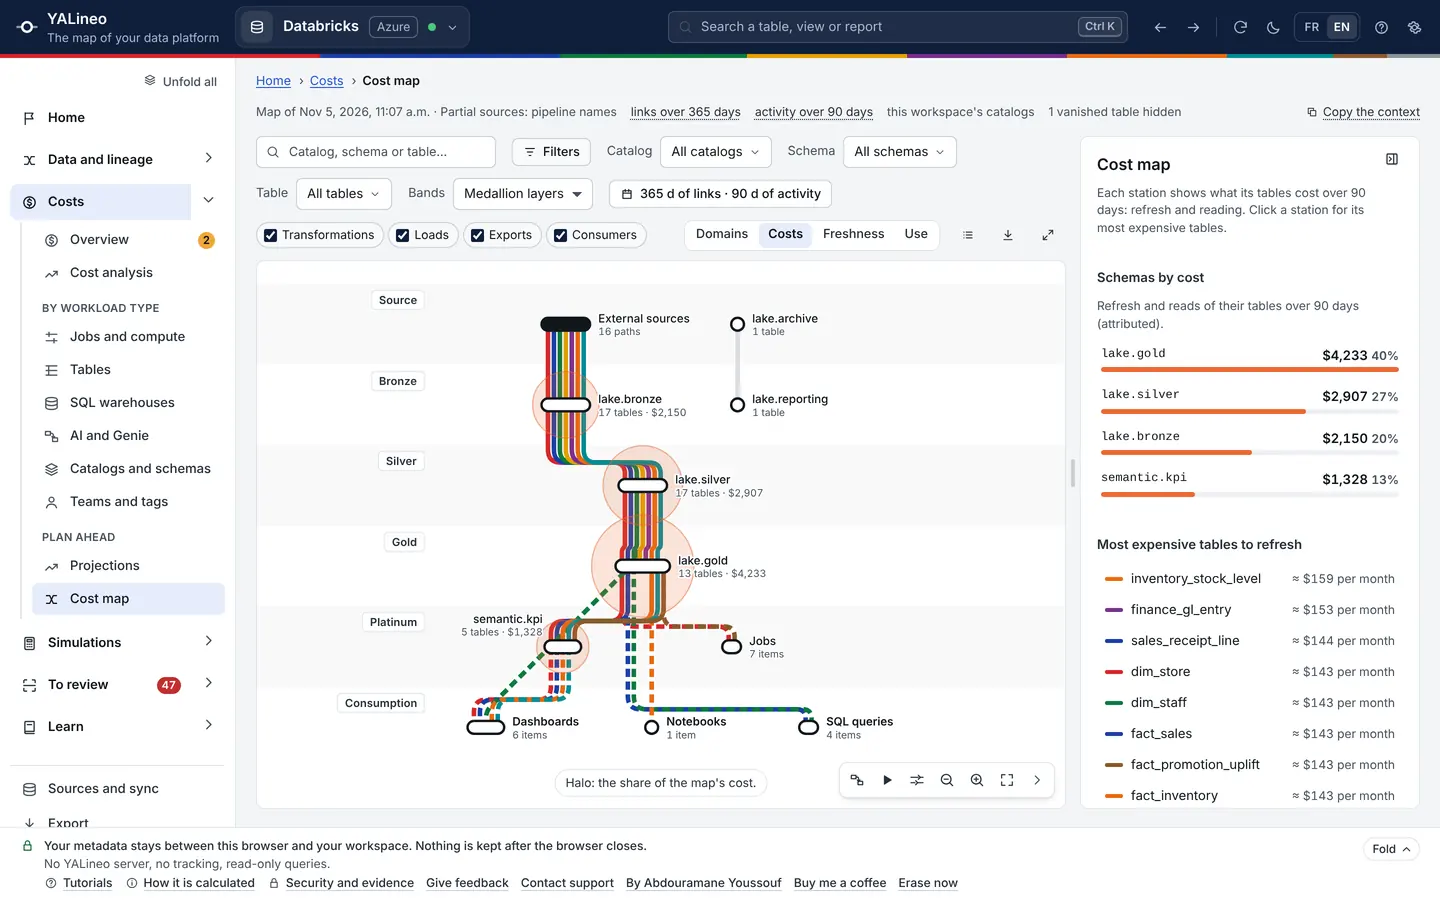

- 1Each station, with the cost of its tables
- 2The schemas, by cost
- 3The tables most expensive to refresh
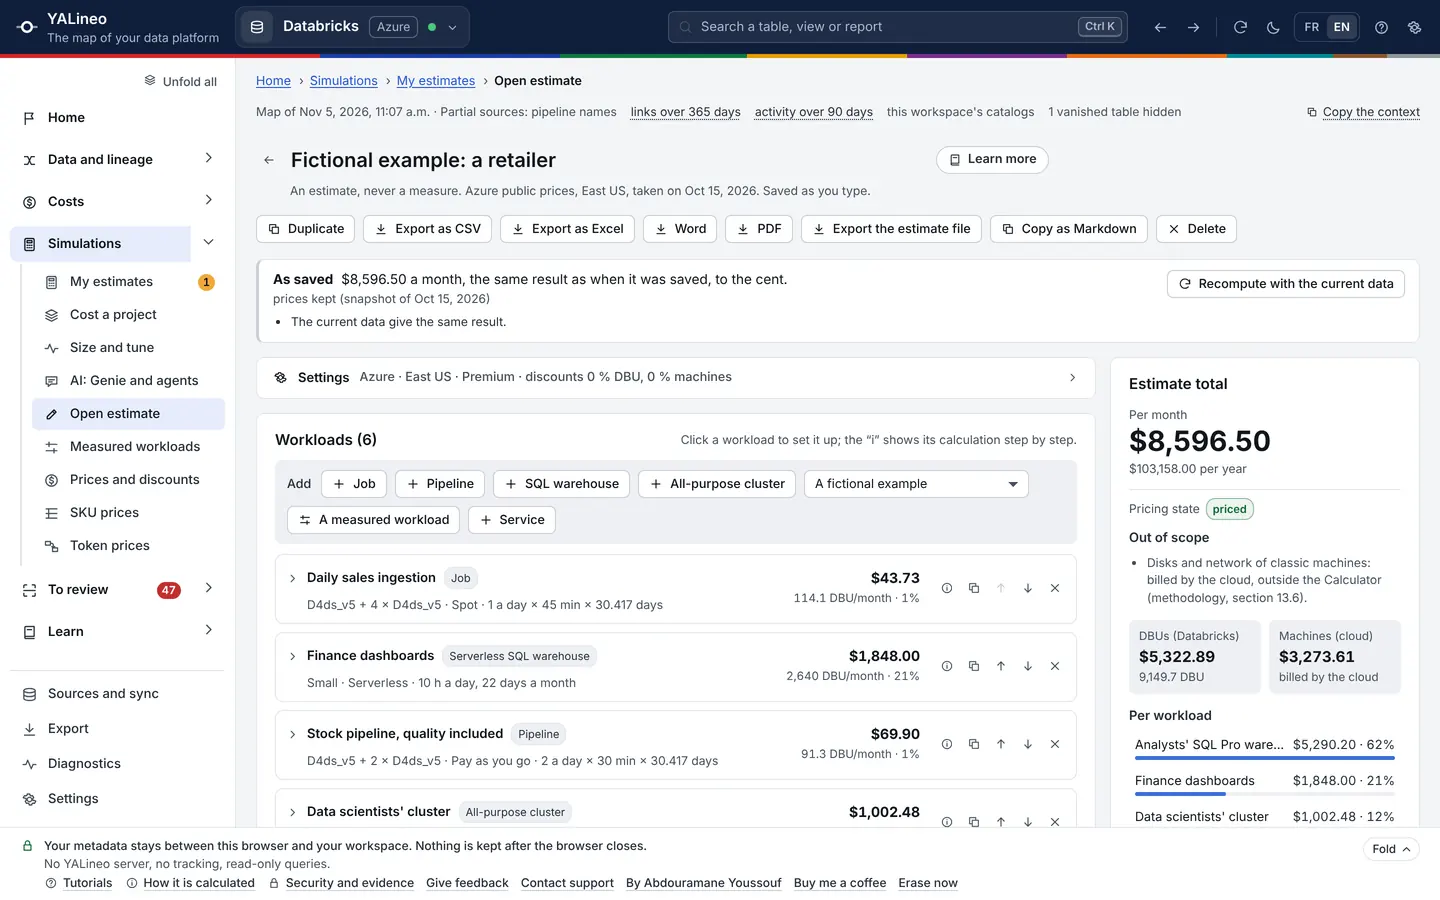

- 1Excel, CSV, Markdown, estimate file
- 2The same total as when saved
- 3Cloud, region, plan, discounts
- 4A workload, a service, a measured one
- 5The total and the pricing state
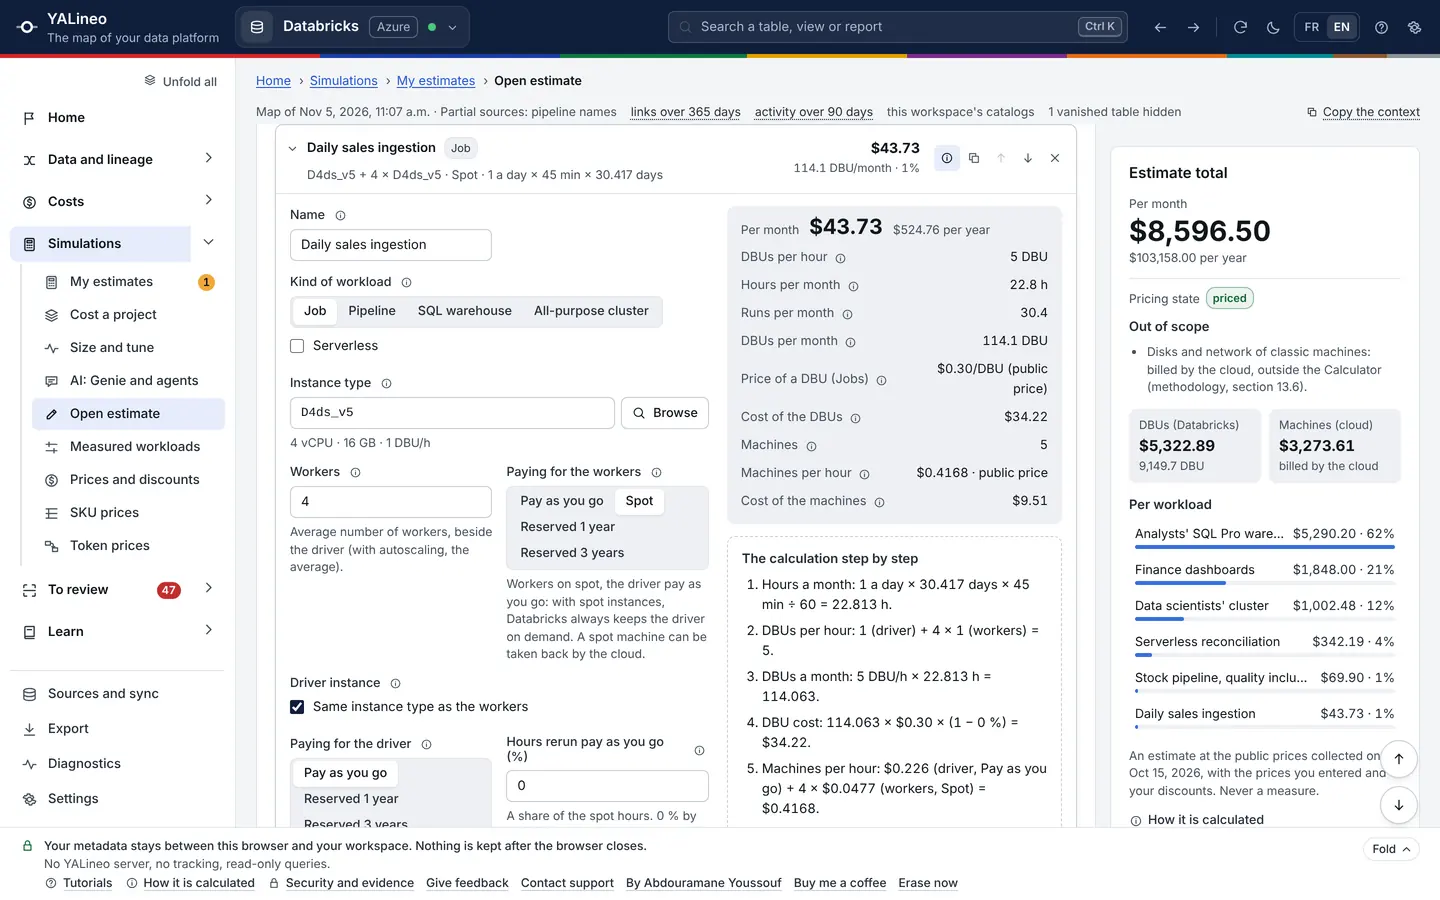

- 1The cloud machine type
- 2Four ways to pay
- 3The calculation step by step, with its numbers
- 4The total of the estimate
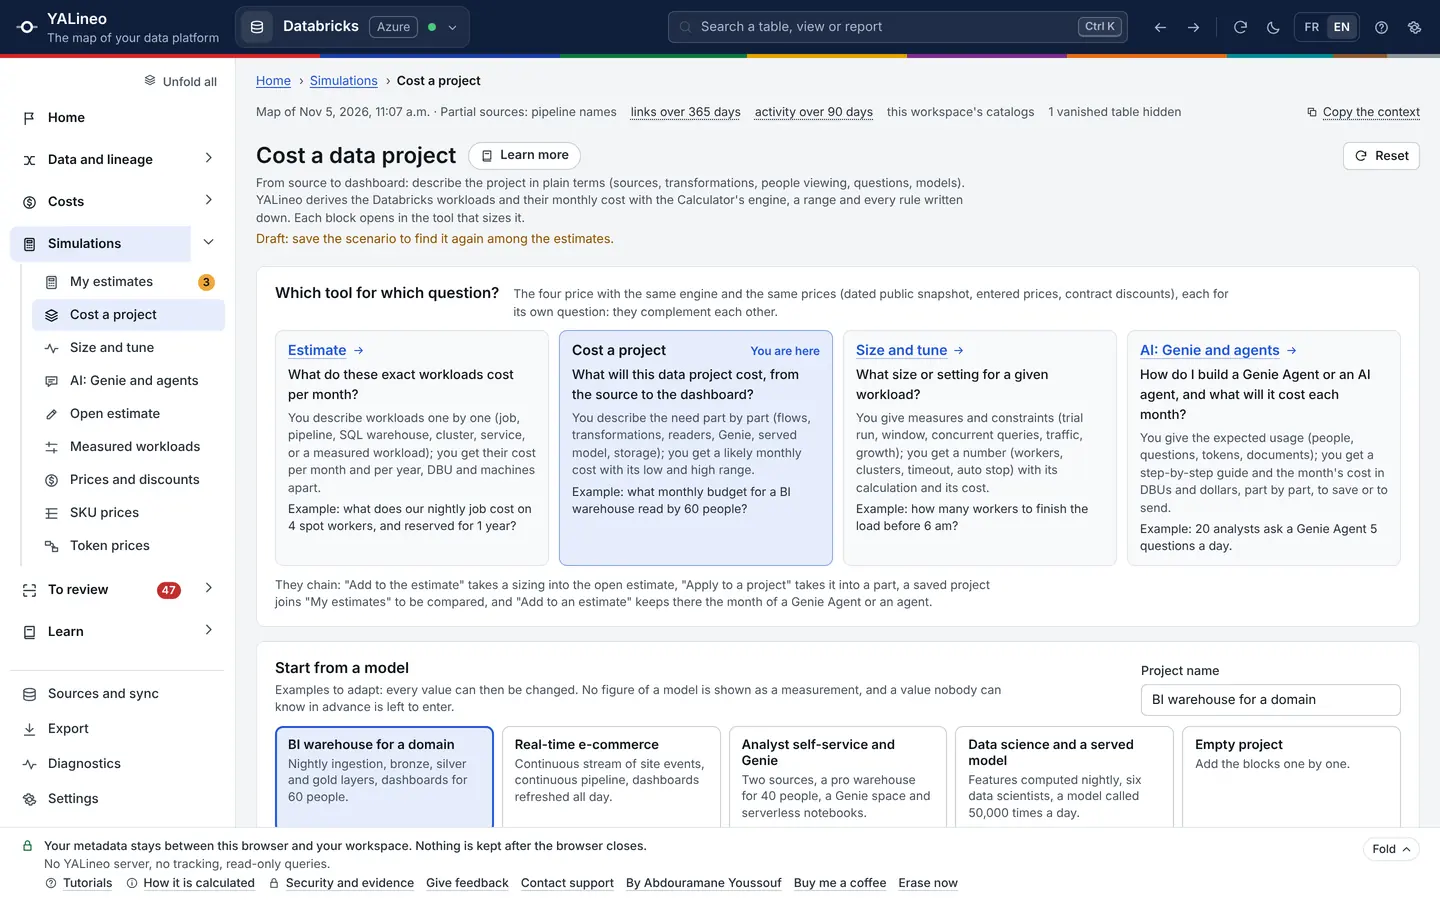

- 1A starting model, to adapt
- 2Each building block, its fields and units
- 3The expected monthly cost and its range
- 4Against your measured platform
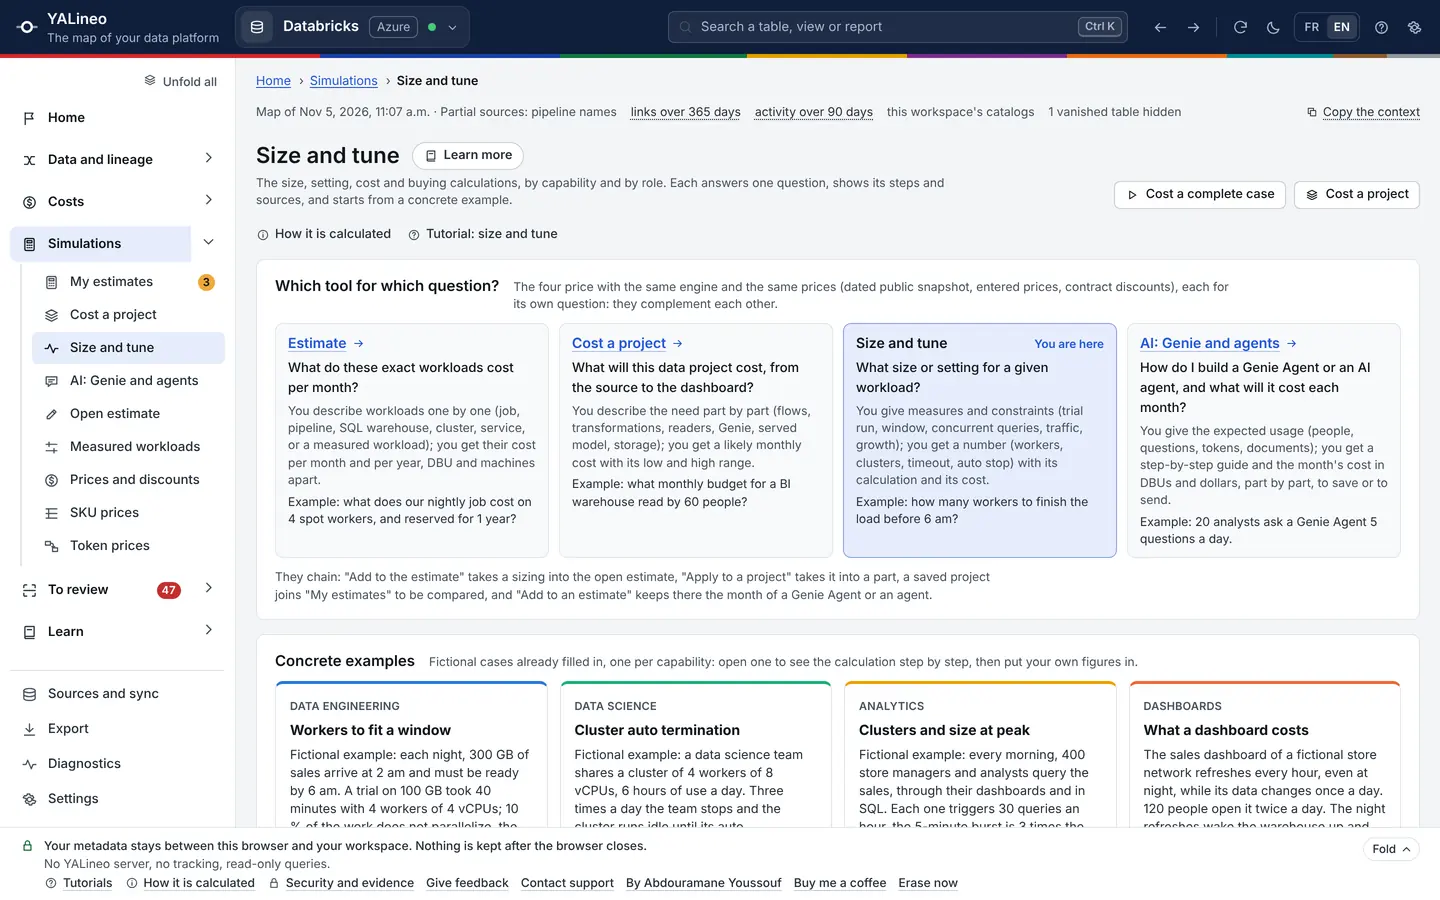

- 1Concrete examples, fictional
- 2Sorted by capability
- 3The example opens filled in
- 4Ten complete cases, each priced
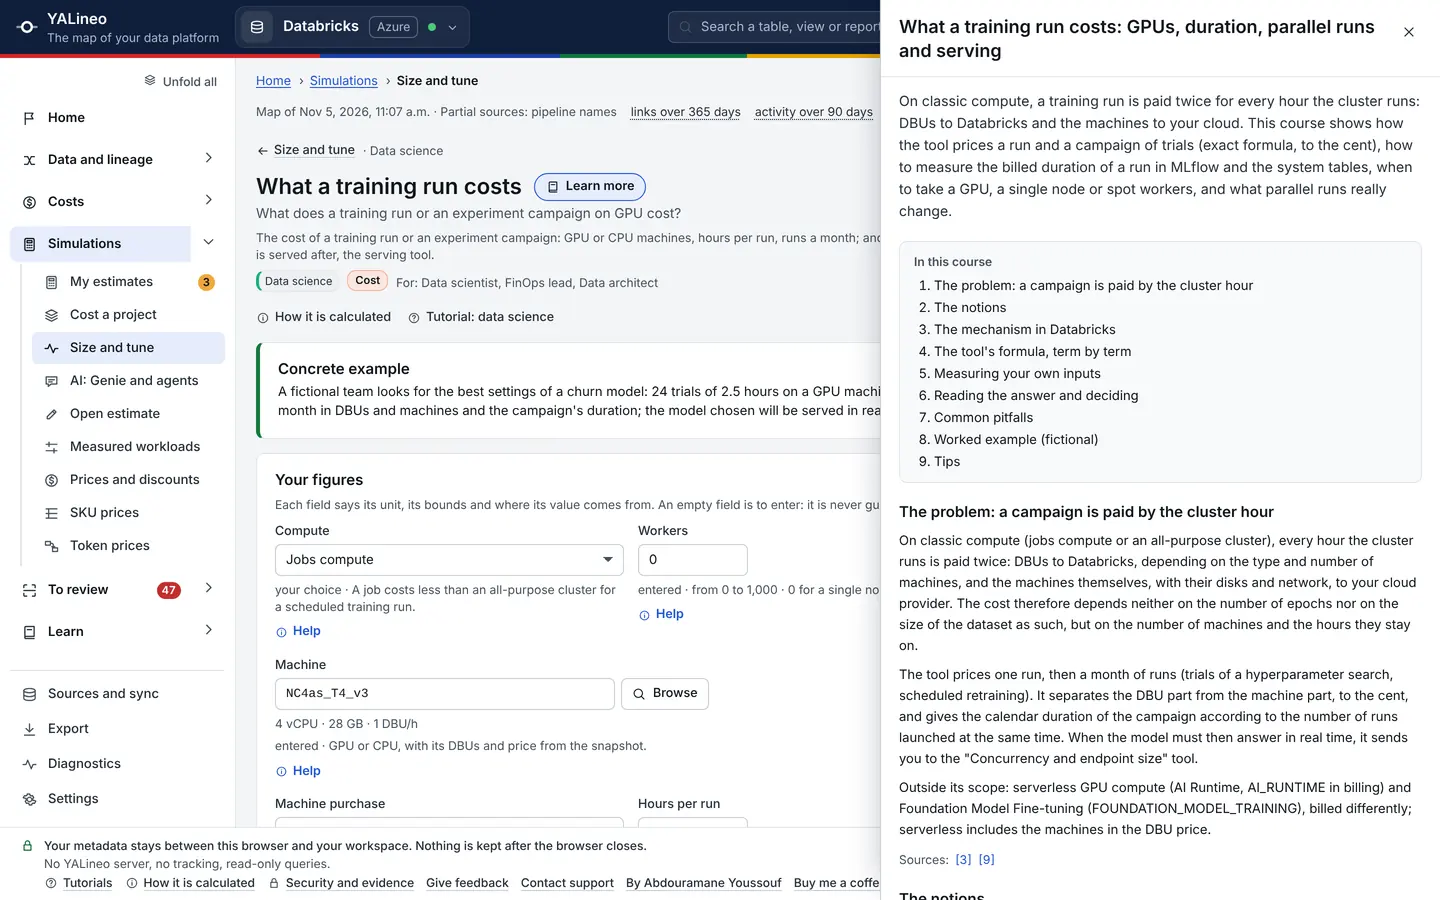

- 1"Learn more", next to the title
- 2The course contents
- 3Each part, with its sources
- 4The fields stay in sight
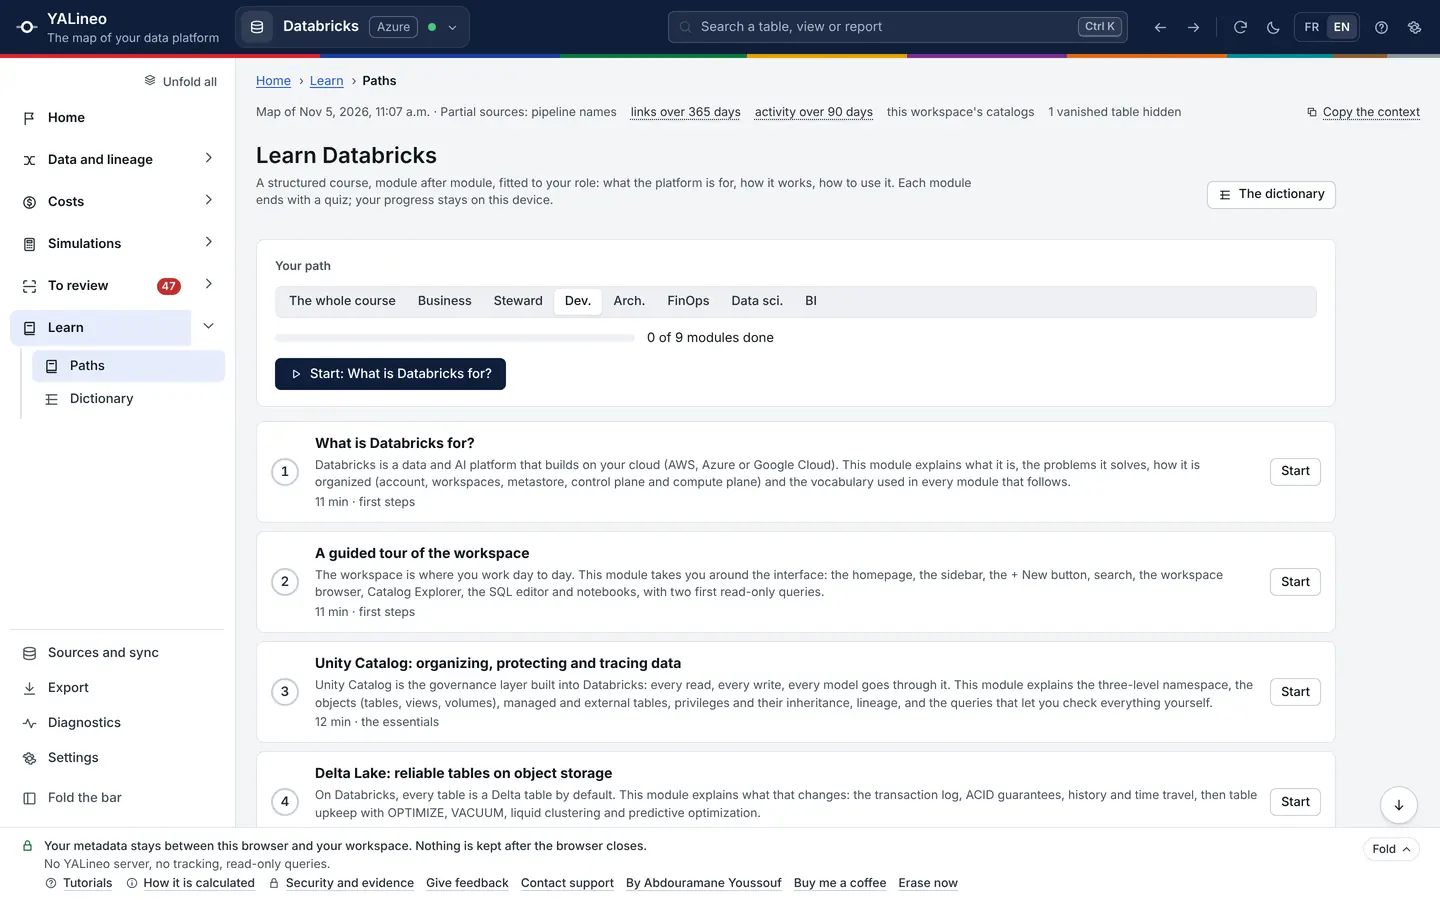

- 1The platform dictionary
- 2A path per profile
- 3Progress, kept on the device
- 4The first module left
- 5Length and level of each module
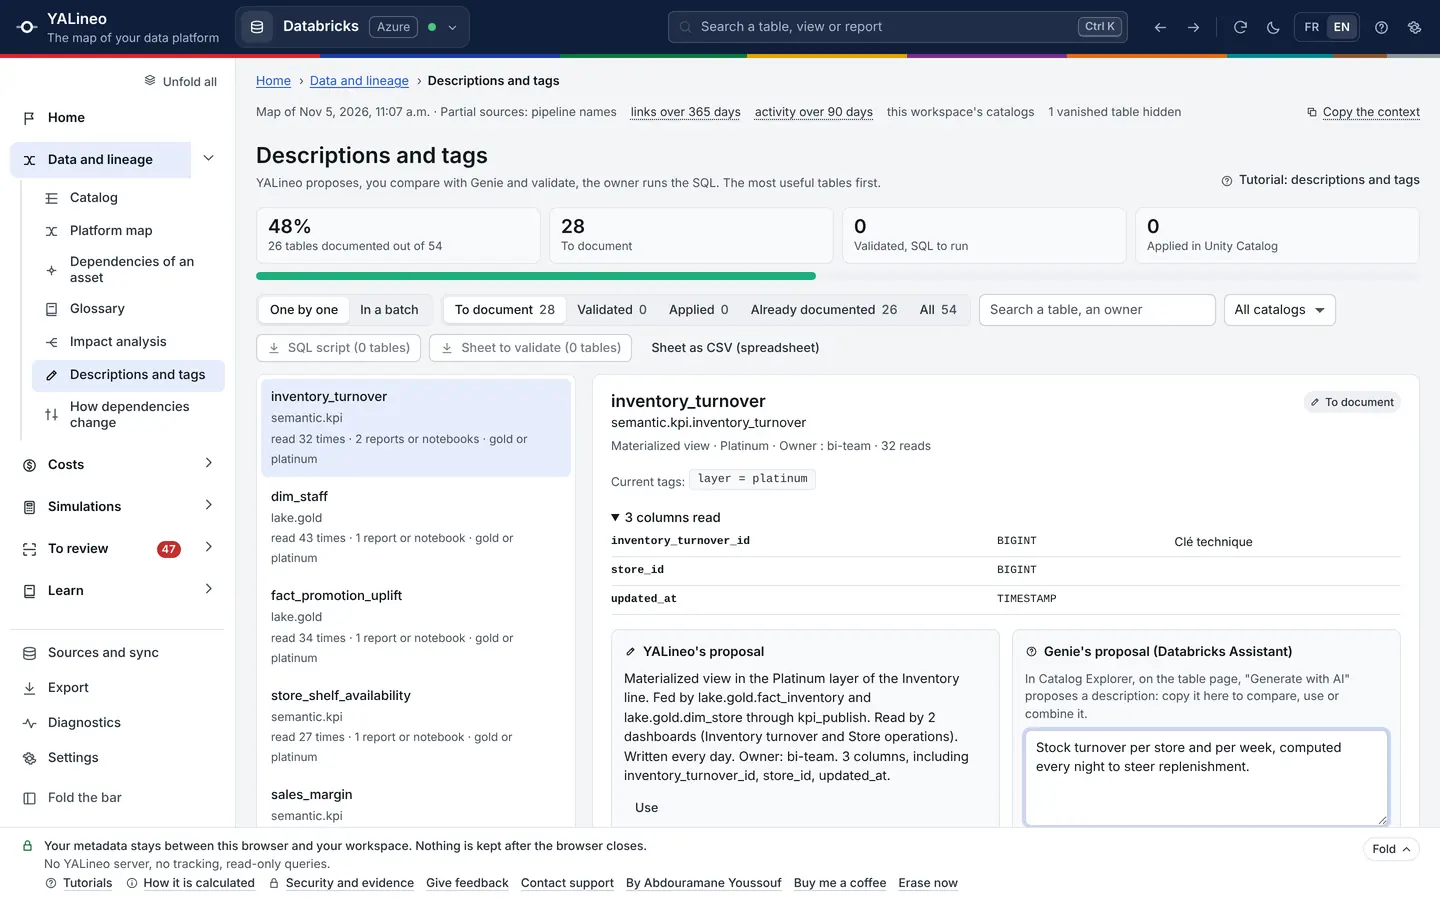

- 1Where the documentation stands
- 2The most useful tables first
- 3YALineo's proposal
- 4Compare it with Genie's
- 5One SQL script per owner
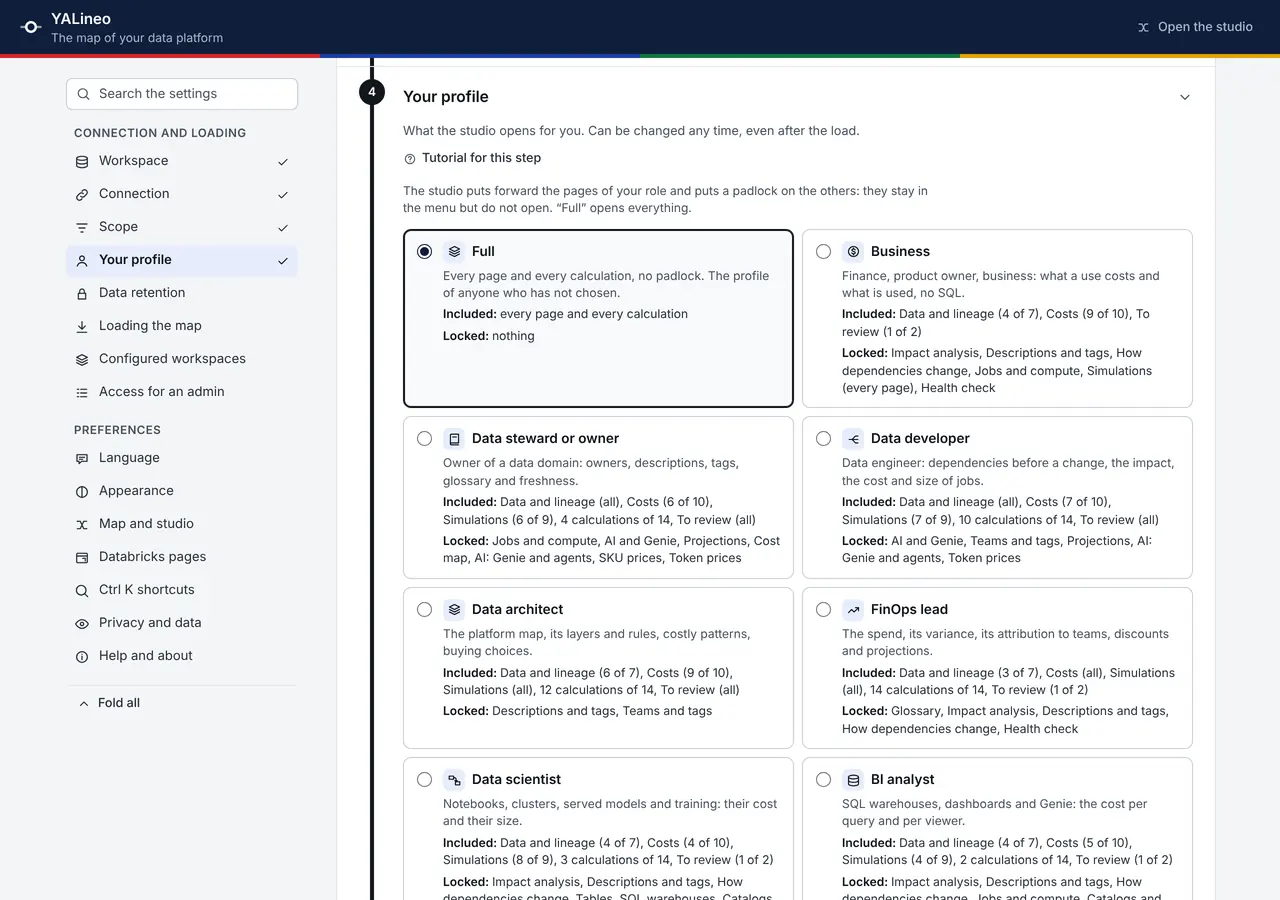

- 1Step 4 of the settings: your profile
- 2"Full", the default: everything open
- 3Seven profiles, one per role
- 4What each includes and locks
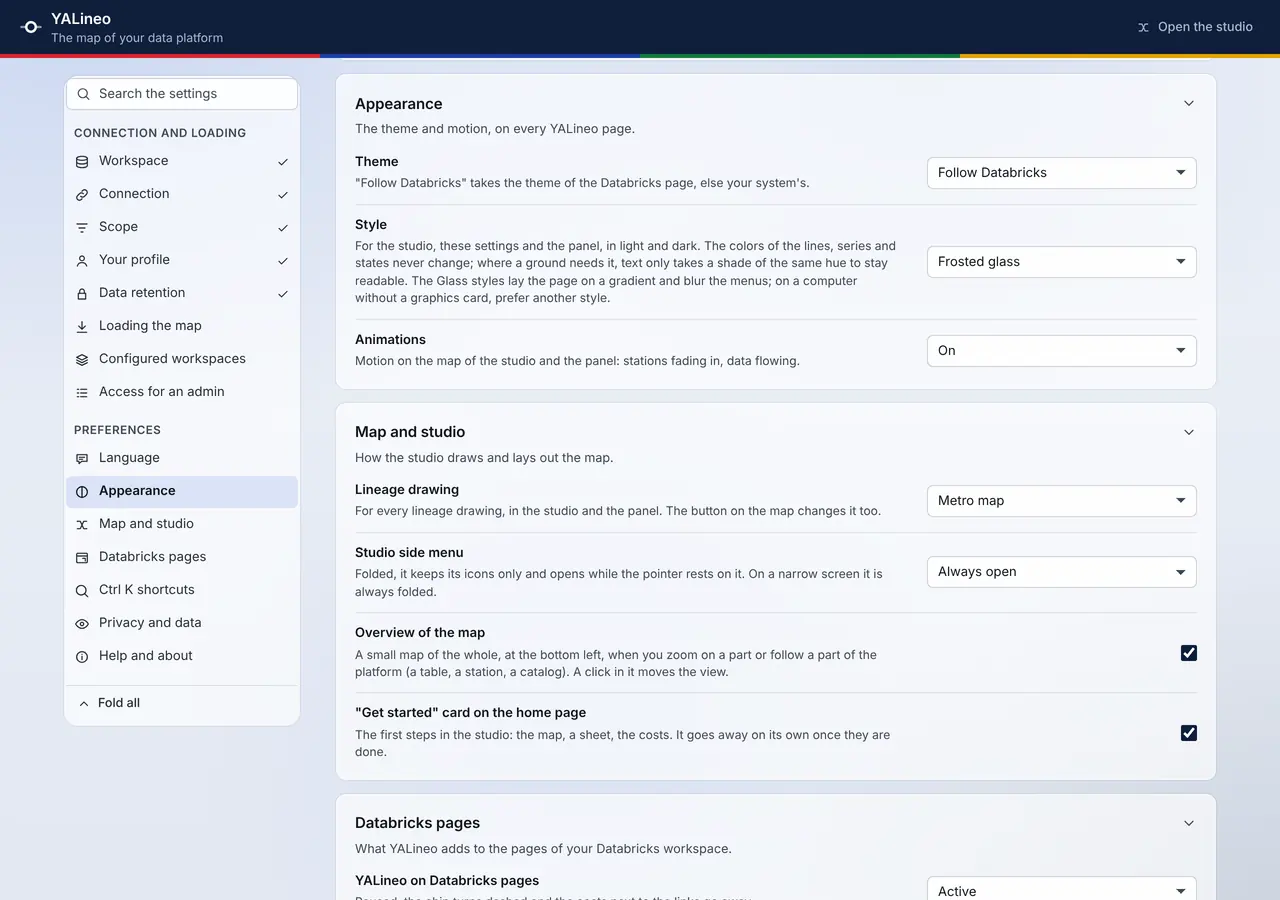
View capture 1 of 2 full sizeView capture 2 of 2 full size


- 1The band, surfaces and inks of the style
- 2The map, its lines and states do not change
- 3Appearance, "Style": eight choices
- 4The light or dark theme, apart
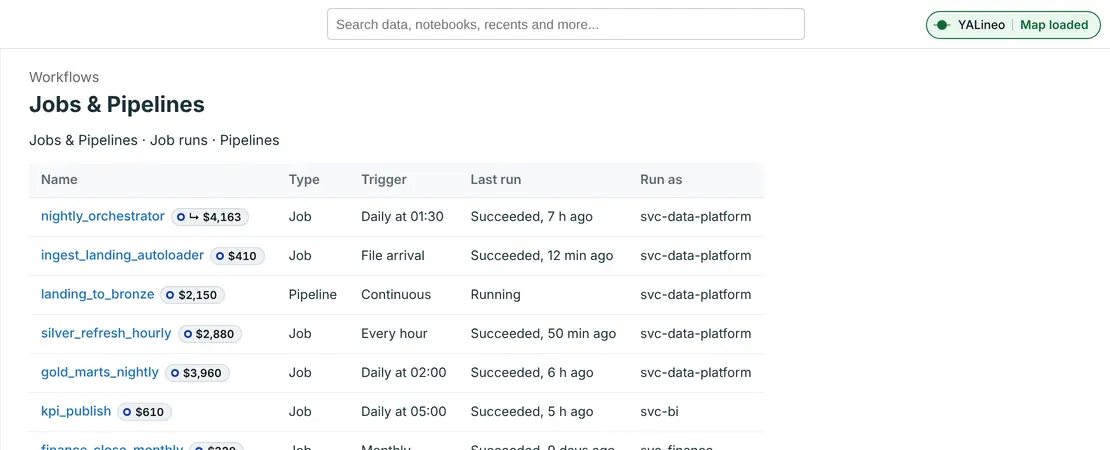

- 1The cost next to each job
- 2Pipelines and warehouses too
- 3The chip shows the map is loaded
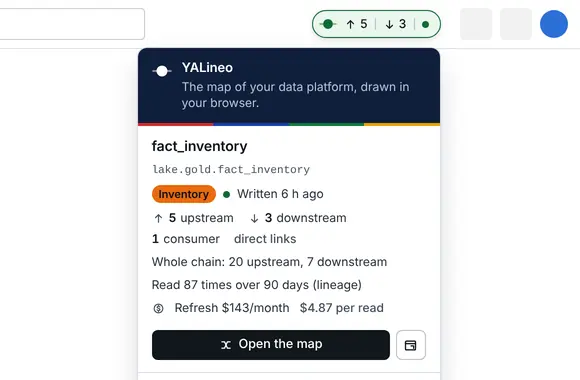
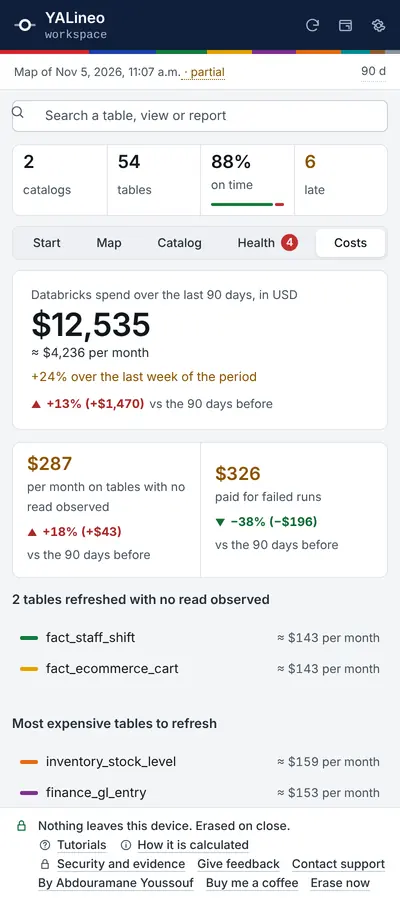
View capture 1 of 2 full sizeView capture 2 of 2 full size


- 1The chip, in the Databricks bar
- 2Its line and freshness
- 3Direct neighbors, then the whole chain
- 4What its refresh costs
- 5The Costs tab of the panel
- 6The period's spend
- 7Tables with no read observed
- 8Most expensive to refresh
Everyday questions, without and with YALineo
| The question | Without YALineo | With YALineo |
|---|---|---|
| What breaks if I change this table? | The Lineage tab of Catalog Explorer, table by table, one level at a time. | The whole route, the severity of each touched asset and a message ready for each owner. See the screen |
| What does this table cost? | The bill per job, to match by hand with the tables it writes. | Its refresh per month, per read and per million rows, and the job that pays. Databricks billing (DBUs and other Databricks units), at list price or with your discount; the classic compute machines, storage and network billed by your cloud are not included. See the screen |
| Why does this table have no link, or no cost? | Queries on the system tables, and the Databricks documentation to read again. | "Why?" gives the measured reason and the action that changes the result; "Check over 365 days" counts the links the map does not show. See the screen |
| Which tables are no longer read? | Queries on the system tables, to write and maintain. | Tables refreshed with no read observed and jobs paying for failures, on one page. See the screen |
| What changed this month? | Two exports to compare in a spreadsheet. | Each card set against the previous period, in color, and the key points written from the figures. See the screen |
| What does Genie cost, and which product? | A line of the bill under a SKU shared with other products. | Genie Code, Genie One and Genie Agents told apart from the billing, free usage shown separately. See the screen |
| Where do we start this week? | Scattered alerts, with no evidence and no follow-up. | The findings to review, each with its evidence, the action that opens the right page and your dated follow-up. See the screen |
| How do we document the catalog? | Table by table, in the Databricks interface. | The most useful tables first, a proposal per table, one SQL script per owner, and a business glossary drawn from what Unity Catalog already says. See the screen |
| How do we welcome a new employee? | Hand-drawn diagrams that soon go stale. | The platform map, its typical route and the tables to know, up to date at each load. See the screen |
| How do we understand Databricks, and each value of a calculation? | The documentation, page by page, and separate training. | The "Learn" section, a path per profile with its quizzes; in each calculation, its course and the help of each field, with the query that reads your value. See the screen |
| What would this new job cost? | Three online calculators and a spreadsheet, where the cloud machines often get forgotten. | The Calculator: DBUs and machines on your cloud, services included, four ways to pay, and the source of every figure. See the screen |
For whom
One map, four ways to read it.
In the studio, a profile per role puts its pages first and a padlock on the others; "Full", the default profile, opens everything. The profile helps you focus, it does not control access, and anyone changes it in the settings.
-
The new employee
Understands on their own how data flows, from sources to reports, starting from the home of the studio.
Their screens
-
The developer
Checks what breaks before changing a table or a column.
Their screens
-
The architect
Keeps the big picture, team rules, the findings to review and a business glossary tied to the tables.
Their screens
-
The platform or FinOps lead
Knows, without writing SQL, what each catalog, each table, each dashboard and each Genie product costs, what runs with no read observed, and what the next project will cost.
Their screens
See your platform in 30 minutes.
On a video call, on your own data read only or on the example platform. On your data, you leave with the map of your platform and the cost of your tables.
The button opens your mail app, Outlook for example, with a message ready to complete.